

Your Facebook Ads manager is screaming “5x ROAS!”
Your Google Ads dashboard looks great.
So why isn’t your bank account growing at the same pace?
If this feels familiar, you’re not alone.
I’ve had this exact conversation with countless founders and marketing VPs.
They’re staring at conflicting reports, drowning in data, and struggling to answer the one question that matters:
Is our marketing spend actually growing the business?
For years, we lived and died by in-platform metrics.
But in today’s world of privacy updates and tracking gaps, those numbers don’t tell the whole story.
It’s time for a better, more honest metric.
As a growth marketer who’s managed over P2.5 billion in ad spend, I’m here to be your expert friend and guide.
We’re going to skip the fluff and get straight to what the Marketing Efficiency Ratio (MER) is, how to calculate it perfectly, and how to use it to make smarter decisions.
TL;DR
What it is: Marketing Efficiency Ratio (MER) is your total revenue divided by your total ad spend. It gives you a holistic, honest view of your marketing performance.
Why it matters: With platform tracking (like ROAS) becoming less reliable due to privacy changes, MER uses your own financial data as the source of truth.
How to use it: Use MER for high-level strategic decisions, budgeting, and finding your point of diminishing returns, not for daily, in-platform campaign tweaks.
Before we use it, we have to understand it. Let’s build a solid foundation.
At its core, Marketing Efficiency Ratio (MER) measures how much total revenue your business generates for every dollar you spend on paid ads.
It’s the ultimate bird’s-eye view of your marketing’s impact on your bottom line.
You’ll also hear it called “Blended ROAS” or “eROAS” (Ecosystem ROAS). They all mean the same thing.
This metric shifts the question from “How did my Google Ads perform?” to “How did my entire marketing budget perform at driving total company revenue?”
The rise of MER isn’t a fad—it’s a necessary response to the new reality of digital marketing.
Privacy changes like Apple’s iOS 14 and the end of third-party cookies have made in-platform tracking fuzzy and incomplete.
MER cuts through this noise.
It anchors your analysis to the one number that is always 100% accurate: your company’s total revenue.
It shows the real correlation between your total ad spend and your total sales.
Both metrics are valuable, but they serve very different purposes. Understanding this is key.
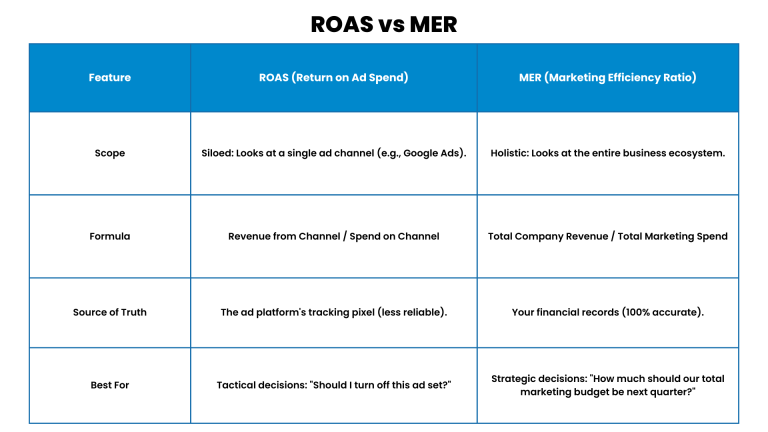
Here’s the analogy I give my clients:
ROAS helps you coach the individual players. MER tells you if you’re actually winning the game.
You need both to build a winning strategy.
This always depends on your company’s profit margins.
A business with 80% margins can thrive with a lower MER than a business with 30% margins.
That said, here are some general benchmarks to aim for:
High-Margin E-commerce: 3.0 to 5.0
Low-Margin E-commerce: 5.0 to 10.0+
SaaS / Subscription: 2.0 to 4.0
Pro Tip: Your first step should be to calculate your breakeven MER. This is the point where you are covering your ad spend and cost of goods. Your goal is to always stay comfortably above that line.
Click here to learn more about Gross margin and Contribution Margin.
A metric is only as good as the data you put into it. Let’s get this part perfect.
There are two levels to this. Start with the simple version, then graduate to the profit-focused one.
1. The Simple MER Formula:

Example: Your business generated $250,000 in total revenue last quarter. You spent $50,000 on all ads. Your MER = $250,000 / $50,000 = 5.0
This means for every $1 you invested in ads, you generated $5 in total revenue.
2. The Profit-Adjusted Formula (POAS):
High revenue is great, but profit is what pays the bills.
That’s why top marketers focus on Profit on Ad Spend (POAS).

This tells you how much actual gross profit you generated for every dollar spent on ads.
It’s the ultimate measure of profitable growth.
To get this right, you must be meticulous.
Use Net Revenue: Always use revenue after discounts, returns, and refunds.
Use Accrual Accounting: This records revenue when the sale is made, not when cash is received, better aligning it with your ad spend.
For SaaS: Use your new and expansion Monthly Recurring Revenue (MRR).
Be Comprehensive: Include every dollar from every paid channel.
All Platforms: Google, Meta, TikTok, LinkedIn, etc.
Other Channels: Influencer fees, affiliate payouts, and podcast sponsorships.
When in doubt, include it. You want the most honest calculation possible.
It’s a strategic chat, not a sales pitch, designed to give you clarity.
You’ve got your number. Now what? This is where we turn data into dollars.
Don’t use your blended MER to make channel-specific decisions.
Instead, use MER as your global source of truth while running incrementality tests.
Here’s how:
Establish Your Baseline MER.
Form a Hypothesis (e.g., “Increasing our YouTube budget will profitably increase total sales.”)
Run a Clean Test (e.g., Increase only the YouTube budget for one week).
Measure the Impact on your Global MER.
The change in your total MER provides a clear signal about that channel’s true value.
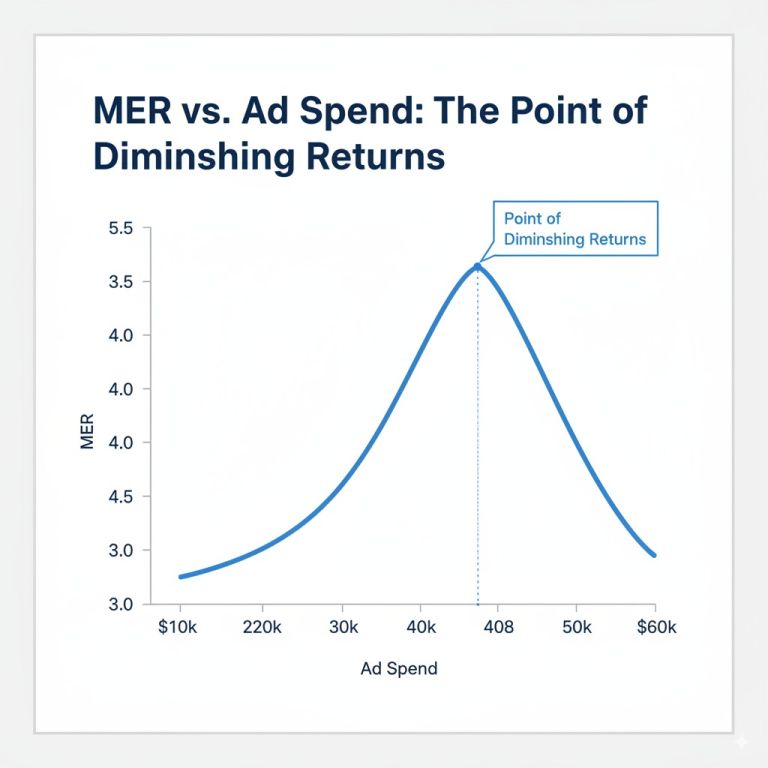
More spend doesn’t always equal better results.
MER is your early warning system for inefficiency.
Track your MER as you scale your budget.
If you see it drop from 4.5 to 3.3 after increasing your budget, that’s a red flag.
It tells you you’ve pushed past the point of efficient scale.
This is how you elevate your role from marketer to strategic leader.
The C-suite cares about profitable growth, and MER tells that story.
Lead with the “Why”: Explain that MER is the most honest measure of marketing’s impact.
Anchor to Profit: Always present MER alongside your Gross Profit and breakeven MER.
Show the Trend: Display a chart of your MER over the last 6-12 months to show progress.
This frames marketing as a profit center, not a cost center.
Click here to learn more about Marketing Accountability.
MER is a powerful tool, but it’s not magic. Here’s how to handle its limitations.
You’re right, it is. It tells you the “what,” not the “why.”
The Fix: Don’t abandon your other metrics! Use in-platform ROAS for daily optimizations, but use MER as the final judge of overall success.
These can definitely skew your data.
The Fix: Keep a simple marketing calendar. Note down promotions, press hits, and other events. This provides context for any unusual spikes or dips in MER.
Comparing your Black Friday MER to your February MER is useless.
The Fix: The most important comparison is always year-over-year (YoY). This normalizes for seasonality and reveals true efficiency improvements.
How often should I recalculate my MER? I recommend looking at it weekly to spot trends and monthly for strategic planning.
Can MER work for a B2B business? Absolutely. For B2B SaaS, use new and expansion MRR in the numerator. For lead-gen, you can assign a pipeline value based on your close rate.
Is a declining MER always bad? Not always. You might intentionally accept a lower MER during a rapid growth phase to gain market share. The key is that this must be a conscious, strategic decision.
Shifting to Marketing Efficiency Ratio isn’t just about a new metric.
It’s about adopting a more resilient way of thinking about growth.
It brings clarity, aligns teams, and builds a sustainable foundation for real, profitable results.
Now I want to hear from you. Have you started tracking MER in your business? Share your experience in the comments below!


Get our best, data-backed strategies and frameworks delivered directly to your inbox. No fluff, just proven insights for building your revenue engine.
Stop leaving your growth to chance. The first step to exceeding your potential is a single conversation. Let’s build your roadmap to sustainable success.