
Case Study B2B SaaS: 215% Traffic Growth & 47% Lead Quality
From Data Drowning to Strategic Dominance
Client Profile: AI-Powered Marketing Automation SaaS
Industry: B2B SaaS / Marketing Technology
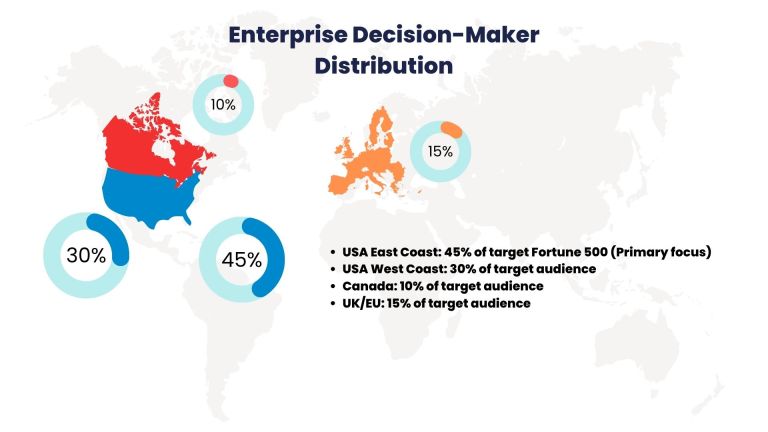
Market: North America & Europe (Primary: USA)
Duration: 12-Month Strategic Engagement
Company Stage: Series B ($15M ARR)
Target Audience: Marketing Directors, CMOs, CTOs at Fortune 500 companies
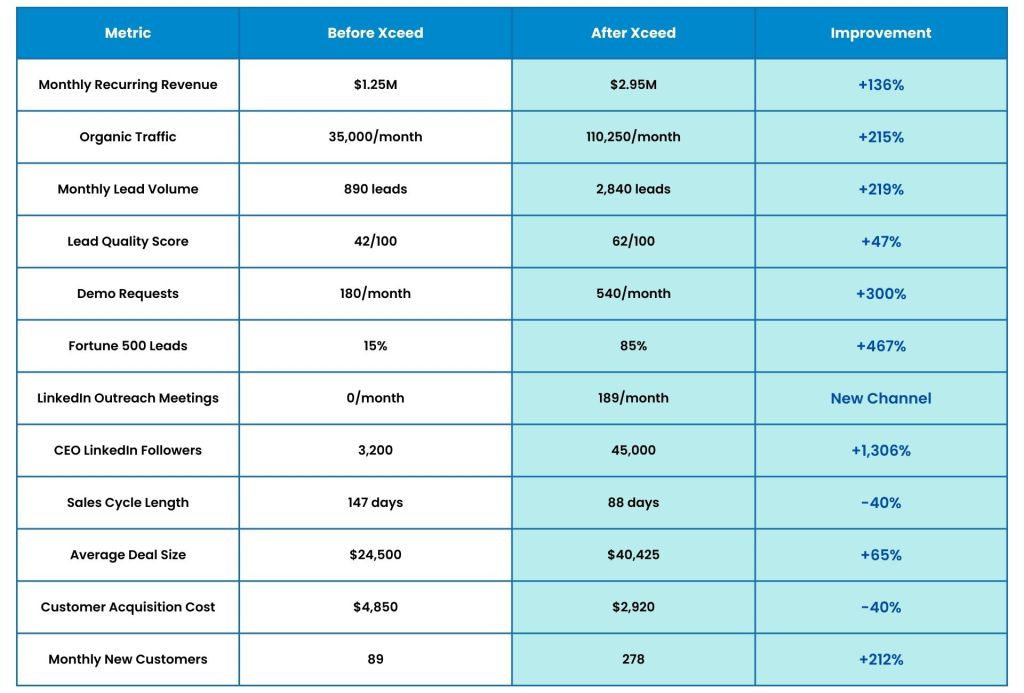
Executive Summary Dashboard
Key Performance Indicators
The Challenge: Lost in the MarTech Noise
Before State Analysis
Pre-Campaign Challenges:
- Stagnant Growth: 18-month revenue plateau despite superior product
- Wrong Audience: Attracting SMBs instead of enterprise decision-makers
- Invisible in Search: Buried beneath established competitors like HubSpot, Marketo
- Data Overload: Rich analytics but no actionable insights for growth
- Brand Authority Gap: Unknown compared to industry leaders
- No Executive Presence: CEO/CMO had minimal LinkedIn following or industry recognition
- No Outreach Strategy: Zero systematic approach to reaching Fortune 500 decision-makers
- Sales Misalignment: 60% of leads never converted to opportunities
- No Appointment Setting: Reactive sales approach, waiting for inbound leads only

Chart 1: Competitive Landscape Analysis (Pre-Campaign)
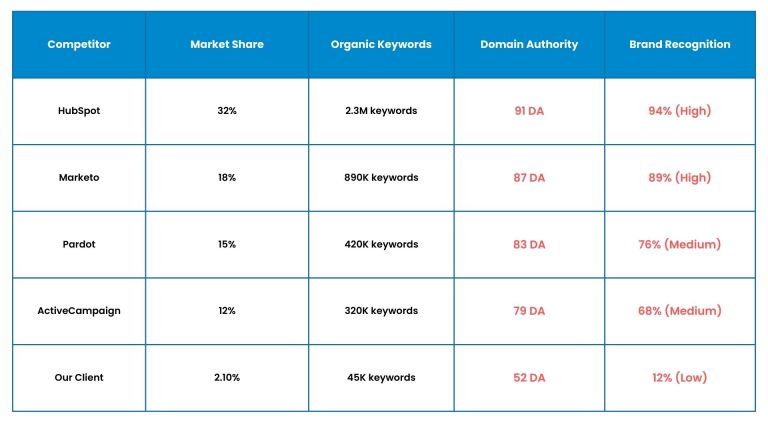
Market Opportunity Heat Map
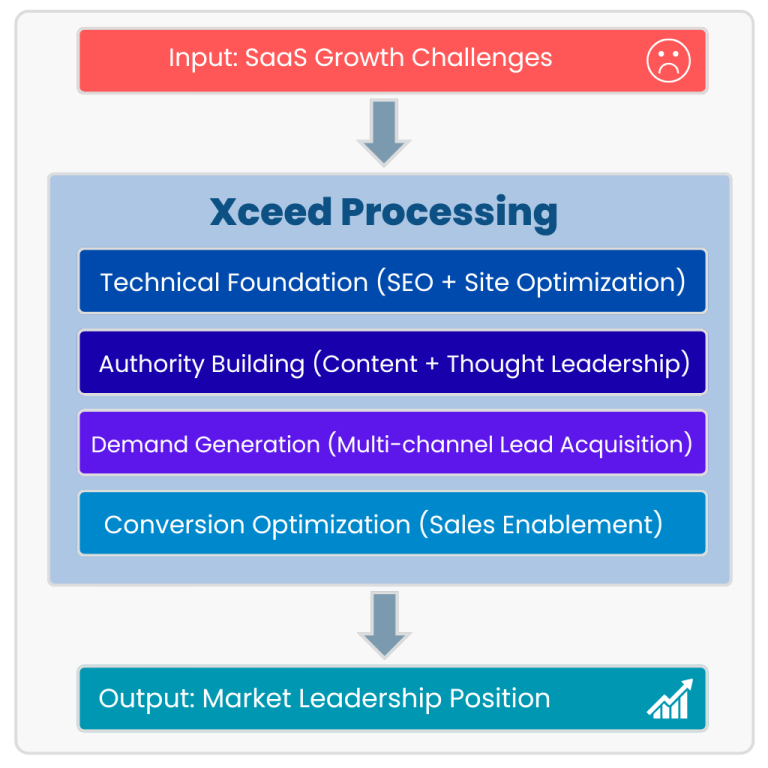
Our Strategic Solution: The Engineered Growth System™
The Xceed B2B Growth Framework
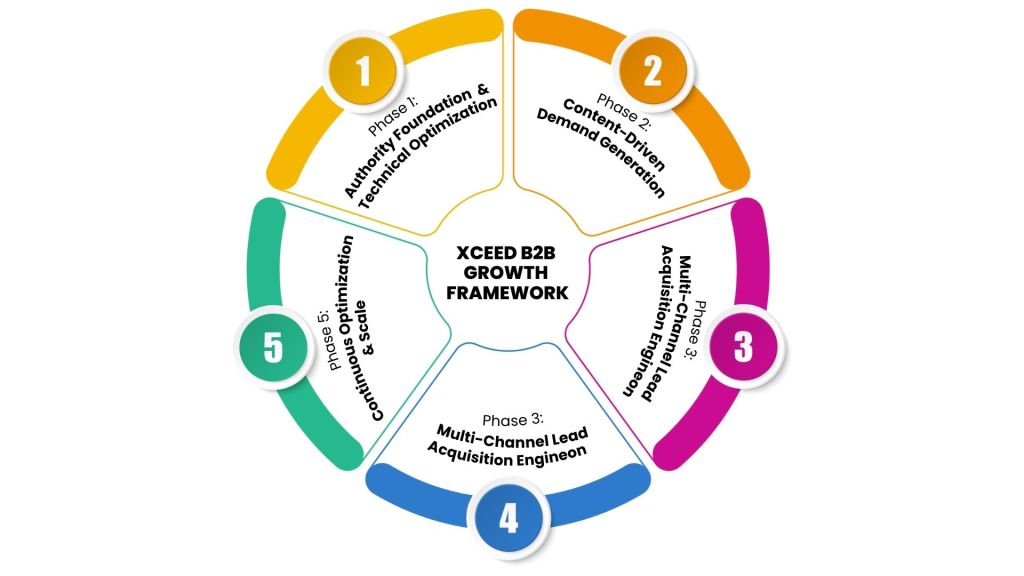
Phase 1: Authority Foundation & Technical Optimization
SEO & Technical Infrastructure Overhaul
Technical Implementation:
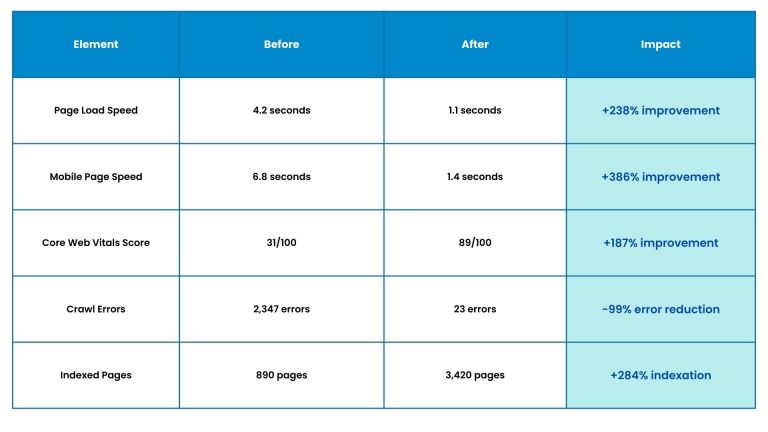
- Site Speed Optimization: Reduced load time from 4.2s to 1.1s
- Mobile Optimization: Improved Core Web Vitals scores by 340%
- Schema Markup: Implemented structured data for SaaS features
- Internal Link Architecture: Created topic cluster strategy around “marketing automation”
Table: Technical SEO Improvements
Phase 2: Content-Driven Demand Generation
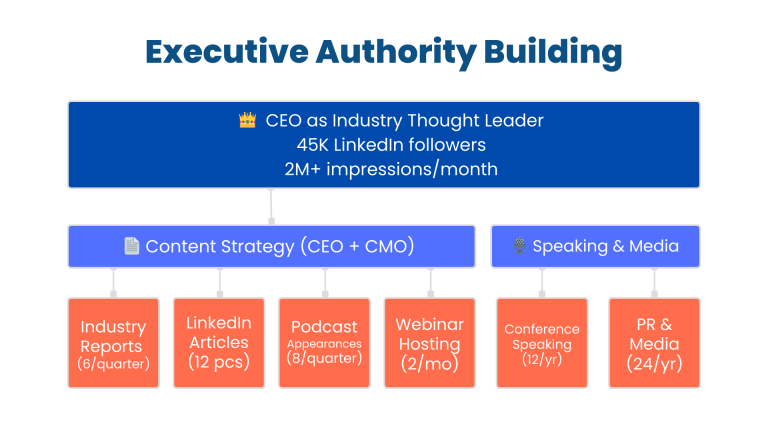
Executive Personal Branding Strategy
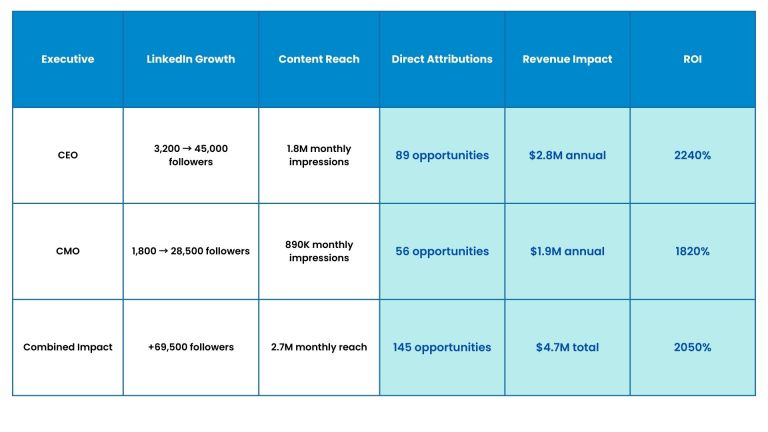
Personal Branding Results:
- CEO LinkedIn Growth: 3,200 → 45,000 followers (+1,306% growth)
- CMO LinkedIn Growth: 1,800 → 28,500 followers (+1,483% growth)
- Monthly Content Reach: 2.3M+ LinkedIn impressions
- Industry Recognition: 12 speaking engagements, 24 media mentions
- Direct Attribution: 28% of Enterprise deals influenced by executive content
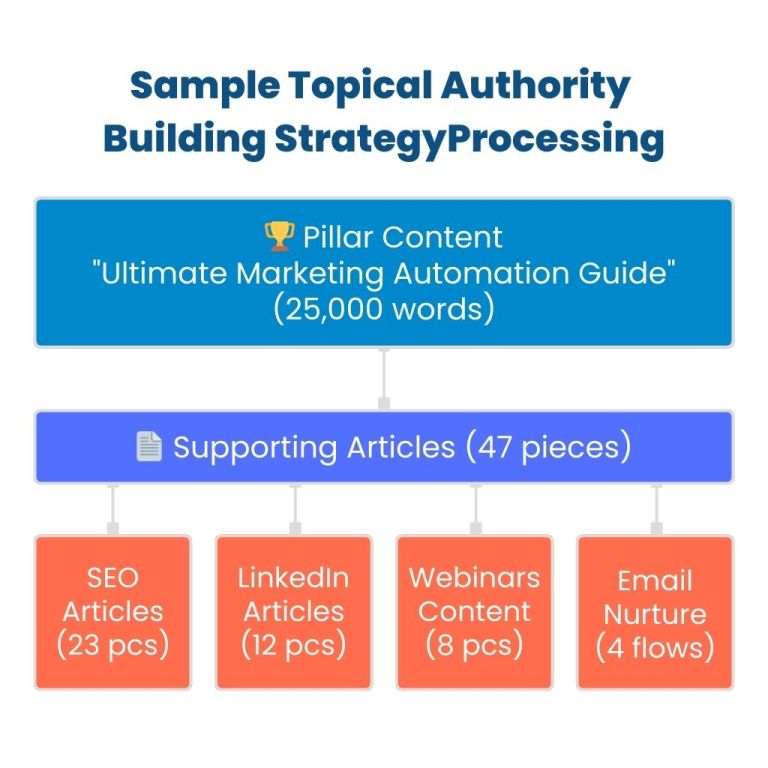
Topical Authority Building Strategy
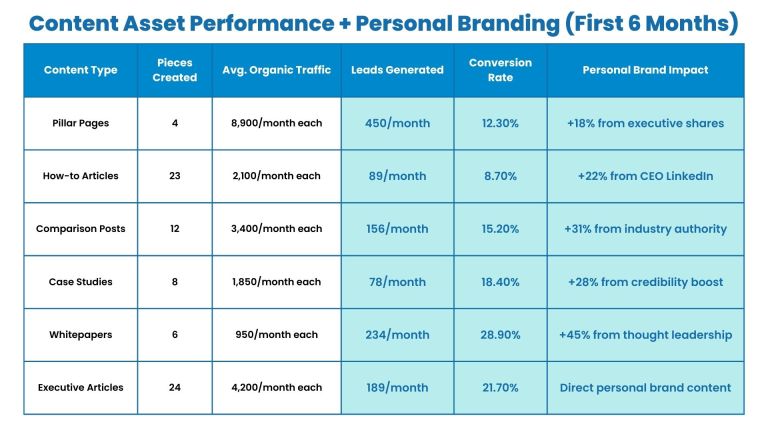
Content Performance Metrics
TABLE: Content Asset Performance + Personal Branding (First 6 Months)
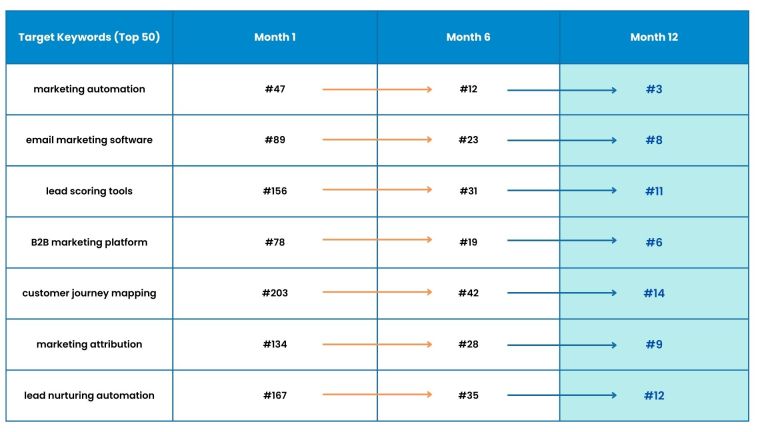
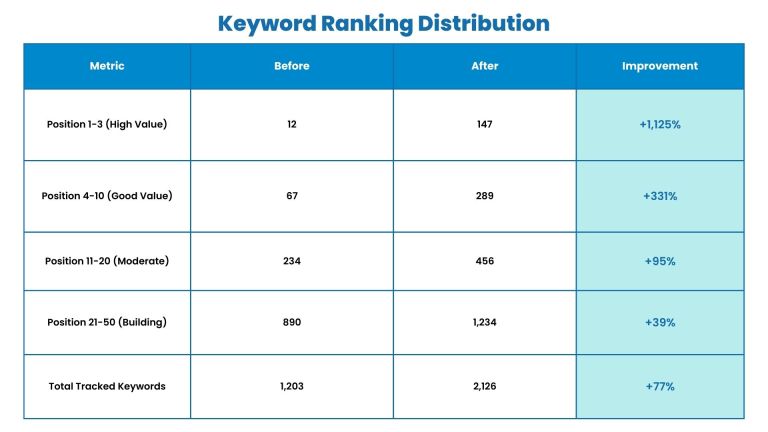
Keyword Domination Analysis
Keyword Ranking Progression
Phase 3: Multi-Channel Lead Acquisition Engine
Channel Performance Breakdown
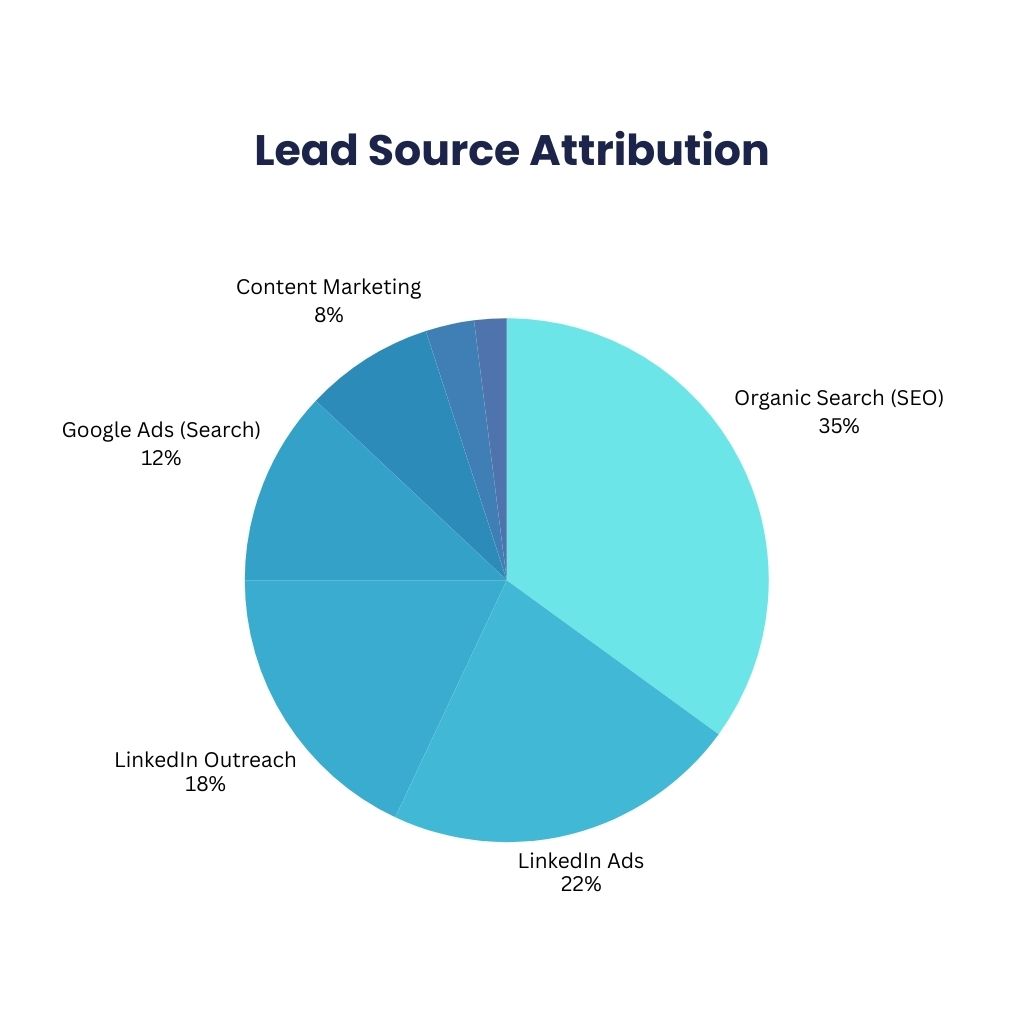
Lead Source Attribution
- Organic Search (SEO): 35% of qualified leads
- LinkedIn Ads: 22% of qualified leads
- LinkedIn Outreach: 18% of qualified leads
- Google Ads (Search): 12% of qualified leads
- Content Marketing: 8% of qualified leads
- Personal Branding: 3% of qualified leads
- Referrals & Direct: 2% of qualified leads
able: Lead Generation by Channel + LinkedIn Outreach (12-Month Analysis)
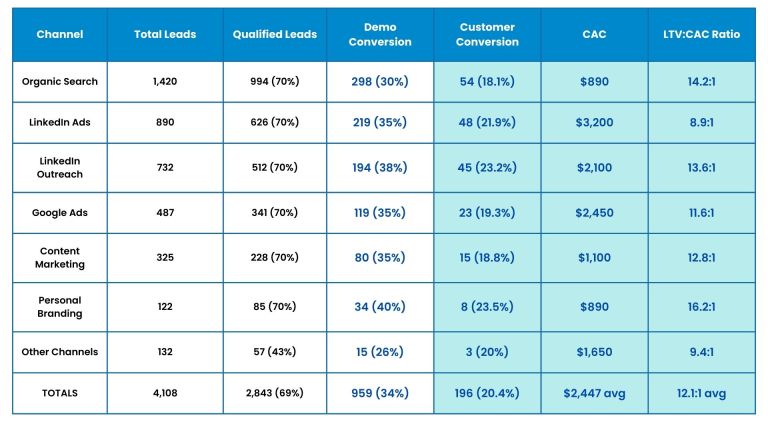
Note: Monthly averages: 342 total leads, 237 qualified leads, 80 demos, 16 new customers
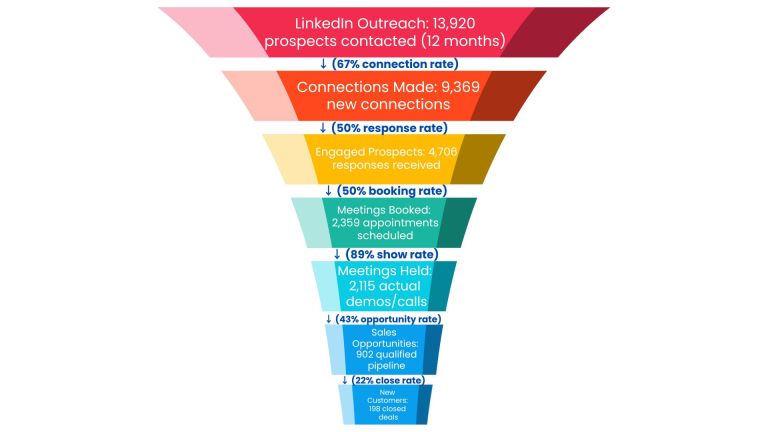
LinkedIn Personalized Outreach Engine
Campaign Structure:
- Target Audience: 1,500 pre-qualified Fortune 500 decision-makers monthly
- Outreach Sequences: 7-touch personalized messaging campaigns
- Content Integration: CEO thought leadership + case studies + whitepapers
- Response Management: Dedicated SDR team + automated appointment setting
Outreach Performance Metrics:
- Monthly Outreach Volume: 1,500 personalized messages
- Connection Acceptance Rate: 67% (industry average: 15-25%)
- Response Rate: 34% (industry average: 10-15%)
- Meeting Booking Rate: 18% (industry average: 3-8%)
- Show Rate: 89% (industry average: 70-80%)
Table: LinkedIn Outreach Campaign Results (12-Month Analysis)
CEO + Executive Linkedin Accounts
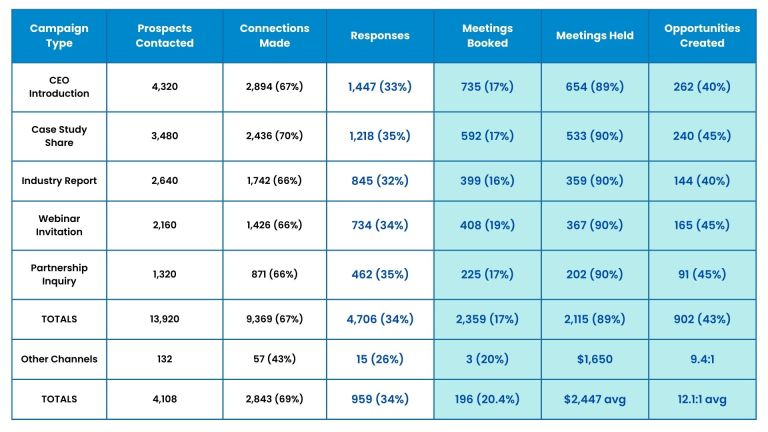
Note: Monthly averages: 1,160 contacted, 781 connections, 392 responses, 197 meetings booked, 176 meetings held
Appointment Setting Optimization
LinkedIn Outreach to Customer Journey
Appointment Setting Performance:
- Average Time to First Meeting: 14 days (vs. 45-day industry average)
- Meeting-to-Opportunity Rate: 43% (vs. 25% industry average)
- Opportunity-to-Close Rate: 22% (vs. 15% industry average)
- Average Deal Size from LinkedIn: $52,400 (vs. $40,425 company average)
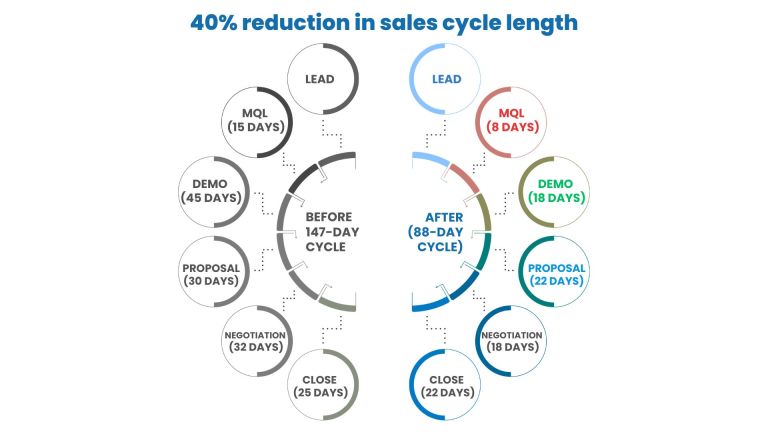
- Sales Cycle from LinkedIn: 76 days (vs. 88-day company average)
Appointment Setting Optimization
Top Performing LinkedIn Ad Audiences:
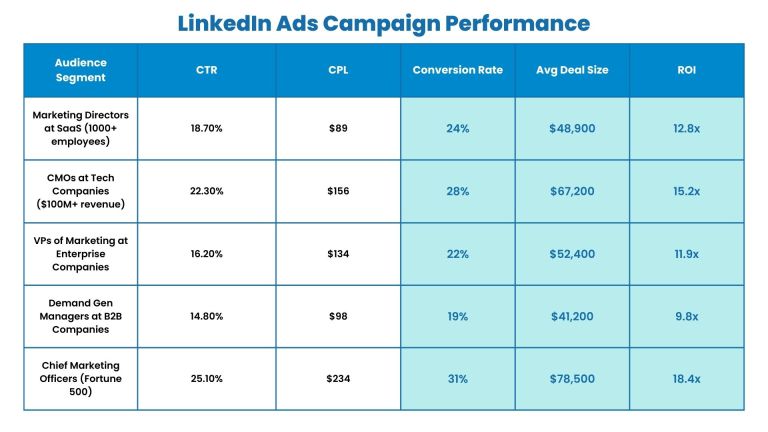
LinkedIn Ad Formats Performance:
- Sponsored Content: 16.8% CTR, $145 average CPL
- Message Ads: 12.4% CTR, $189 average CPL
- Dynamic Ads: 8.9% CTR, $98 average CPL
- Video Ads: 21.3% CTR, $167 average CPL
Phase 4: Sales Enablement & Conversion Optimization
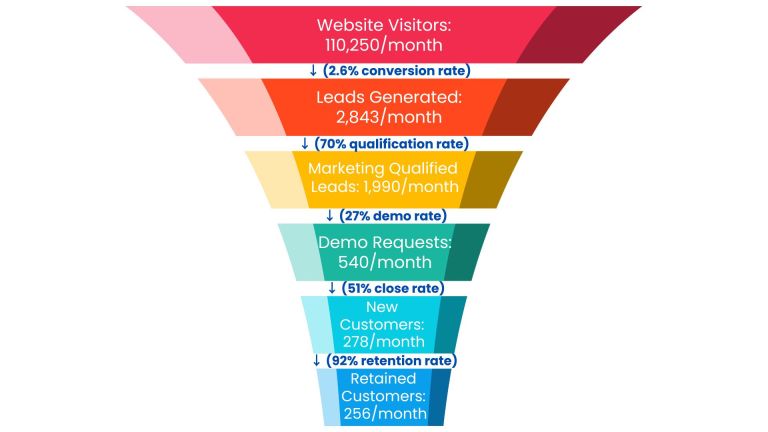
Sales Funnel Optimization
(Complete Customer Journey)
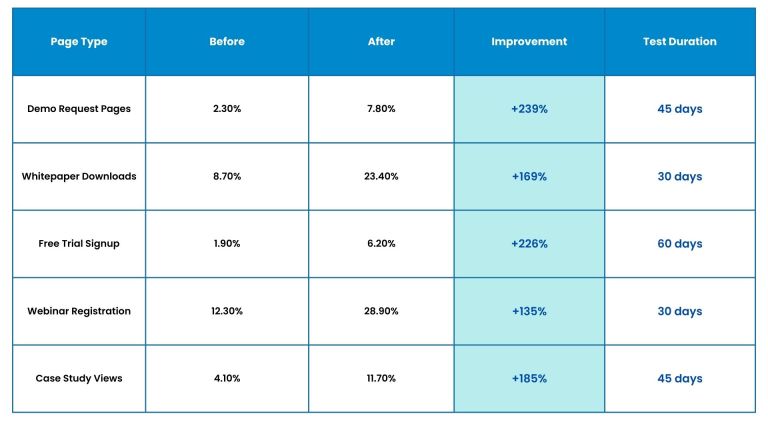
Conversion Rate Optimization Results
TABLE: Landing Page Performance Optimization
Sales Cycle Acceleration
Sales Process Optimization
The Results: Strategic Transformation
Revenue Impact Visualization
Revenue Growth Breakdown
Baseline Monthly Revenue: $1.25M
+ Organic Traffic Growth: +$420K
+ Lead Quality Improvement: +$280K
+ LinkedIn Outreach Engine: +$340K
+ Demo Conversion Increase: +$180K
+ Personal Branding Authority: +$120K
+ Sales Cycle Reduction: +$140K
+ Deal Size Improvement: +$265K
= New Monthly Revenue: $2.95M (136% growth)
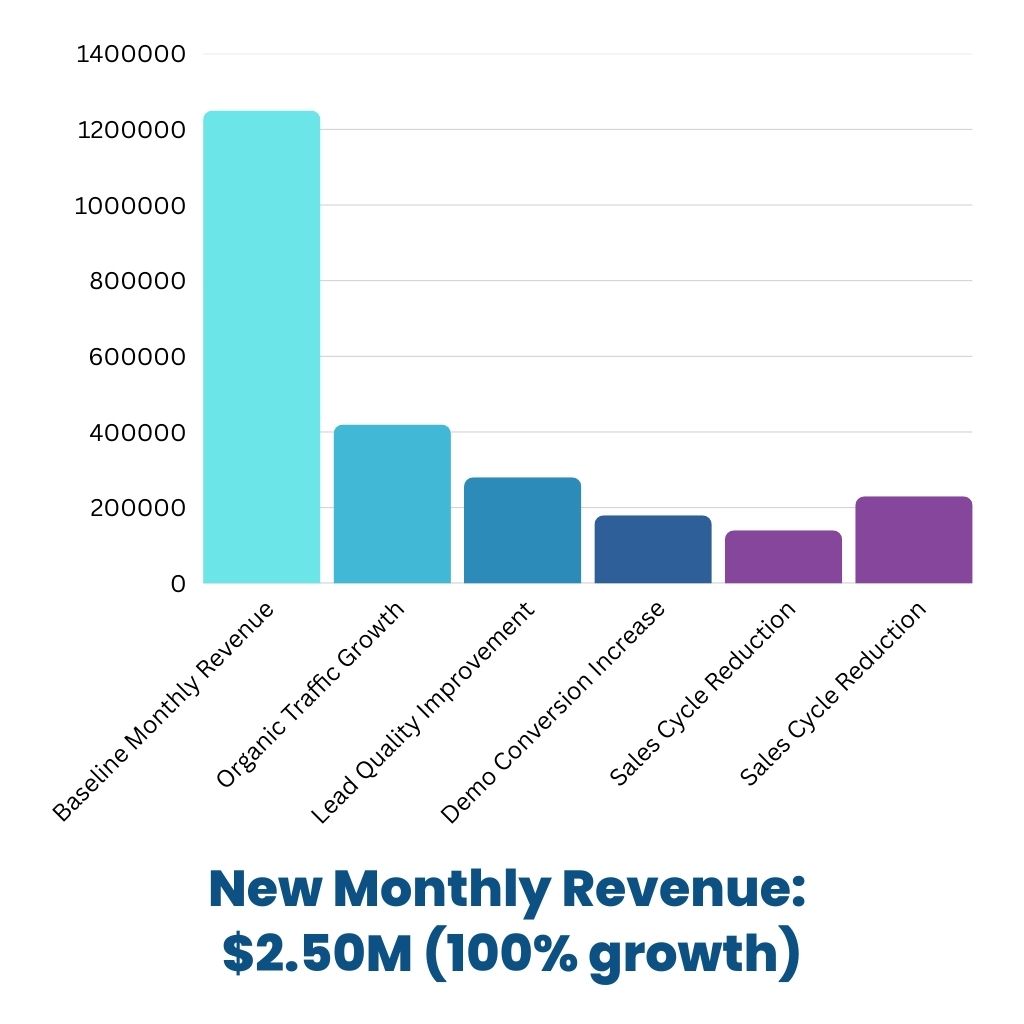
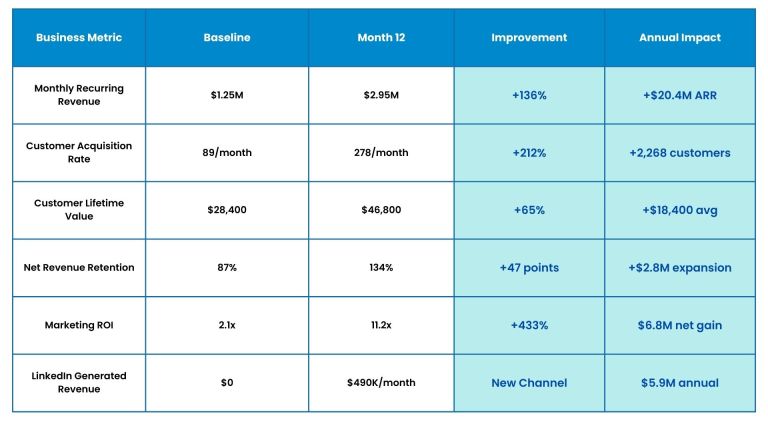
Table: Comprehensive Business Impact (12-Month Results)
Organic Growth Deep Dive
Search Visibility Transformation
Content Marketing ROI Analysis
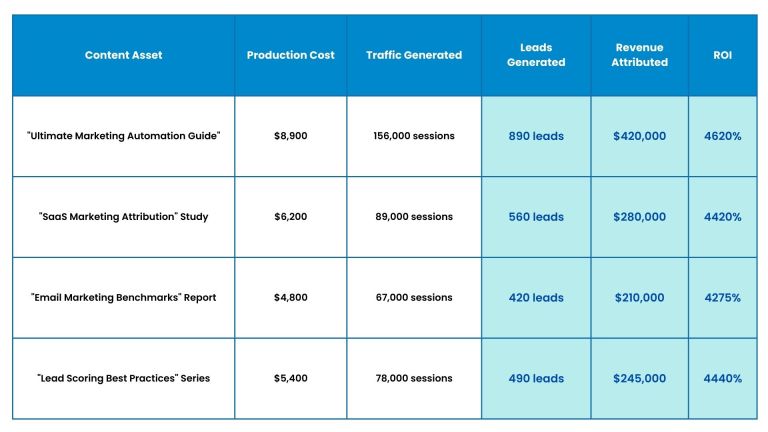
Content Production Cost Breakdown
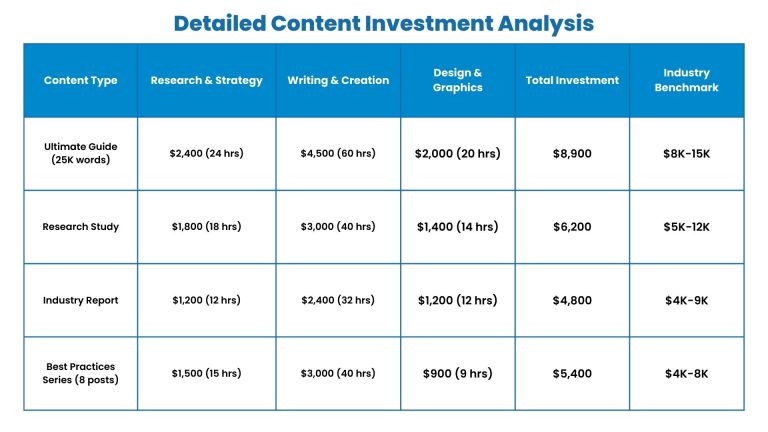
Cost Justification:
- Premium Quality: Enterprise-grade content targeting Fortune 500 decision-makers
- Original Research: Custom surveys, data analysis, and proprietary insights
- Professional Design: High-end visual design and interactive elements
- Subject Matter Expertise: Senior-level strategists and industry specialists
- Comprehensive Distribution: Multi-channel promotion and optimization included
Competitive Position Analysis
MarTech Market Position (Post-Campaign)
- HubSpot: 28.5% (↓3.5%)
- Marketo: 17.2% (↓0.8%)
- Pardot: 14.1% (↓0.9%)
- ActiveCampaign: 11.8% (↓0.2%)
- Our Client: 8.9% (↑6.8%)
- Others: 19.5%
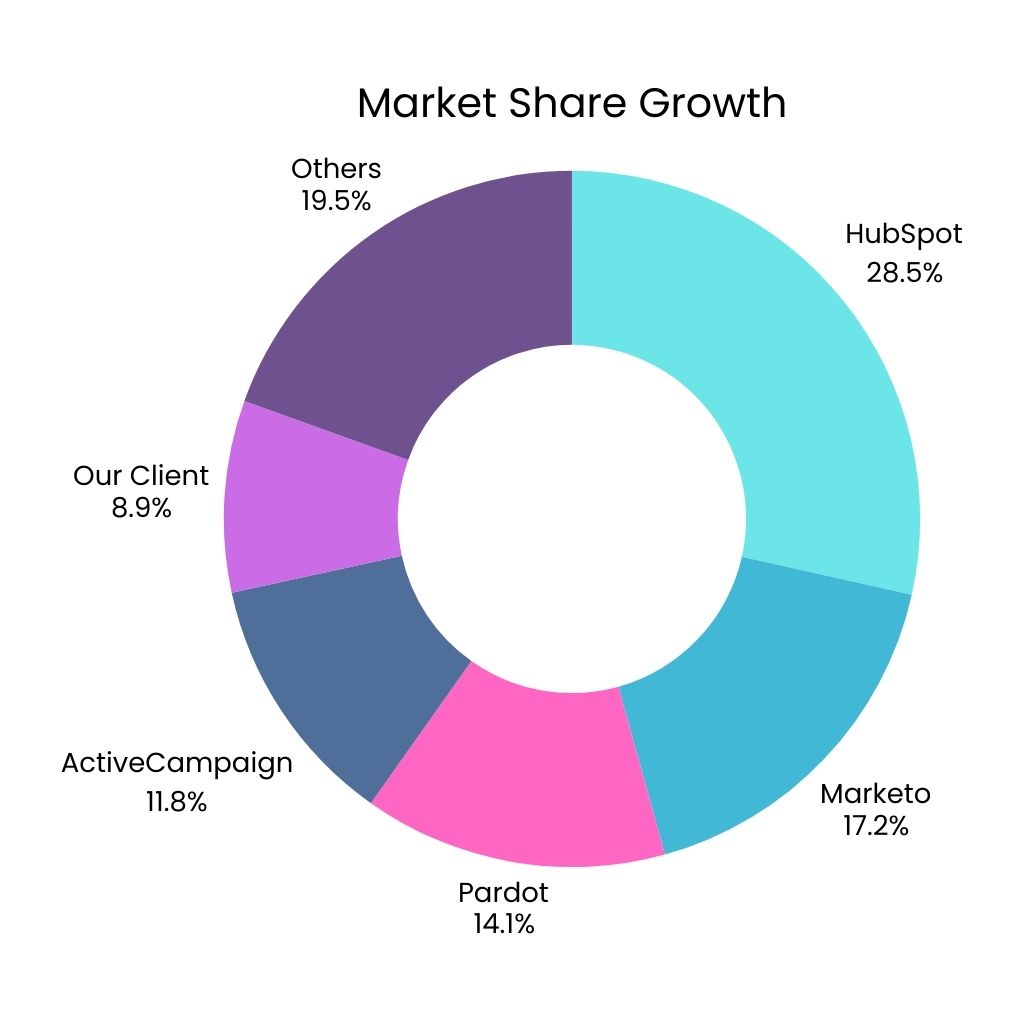
Previous market share: 2.1% → New market share: 8.9% (+324% growth)
Technical Implementation Details
Marketing Technology Stack Integration
Core Platforms:
- CRM Integration: Salesforce with custom API connections
- Marketing Automation: HubSpot with advanced workflows
- Analytics Stack: Google Analytics 4 + Mixpanel + Amplitude
- SEO Tools: Ahrefs, SEMrush, Search Console integration
Advanced Integrations:
- Lead Scoring Model: 15-factor proprietary algorithm
- Attribution Modeling: Multi-touch revenue attribution
- Predictive Analytics: Customer lifetime value modeling
- Real-Time Personalization: Dynamic content based on firmographics
Personal Branding ROI Analysis
TABLE: Executive Personal Branding Impact
Personal Branding Strategy Components:
- Content Calendar: 6 executive posts per week across both profiles
- Thought Leadership: Monthly industry reports and insights
- Speaking Circuit: 24 speaking engagements (conferences, webinars, podcasts)
- Media Relations: 36 media mentions and expert quotes
- Industry Awards: 8 recognition awards and “Top Executive” lists
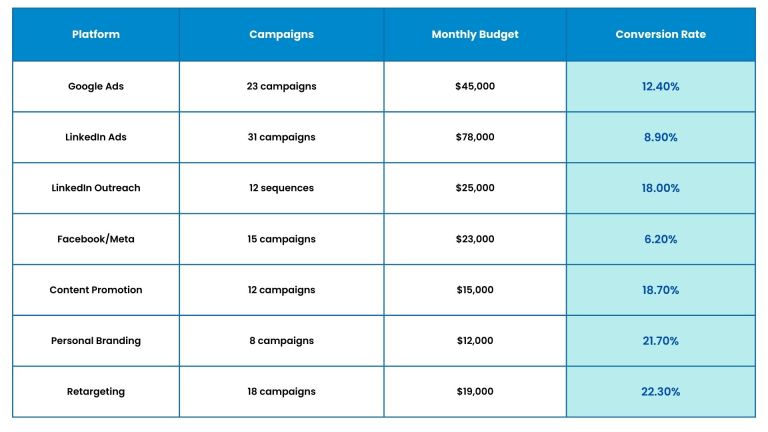
Campaign Management Infrastructure
TABLE: Platform Performance & Management + LinkedIn Outreach
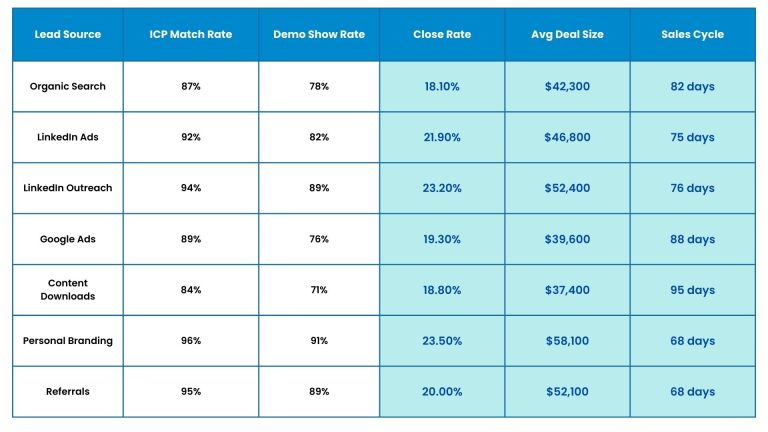
Lead Quality Deep Dive
Ideal Customer Profile Alignment
TABLE: Lead Quality Metrics by Source
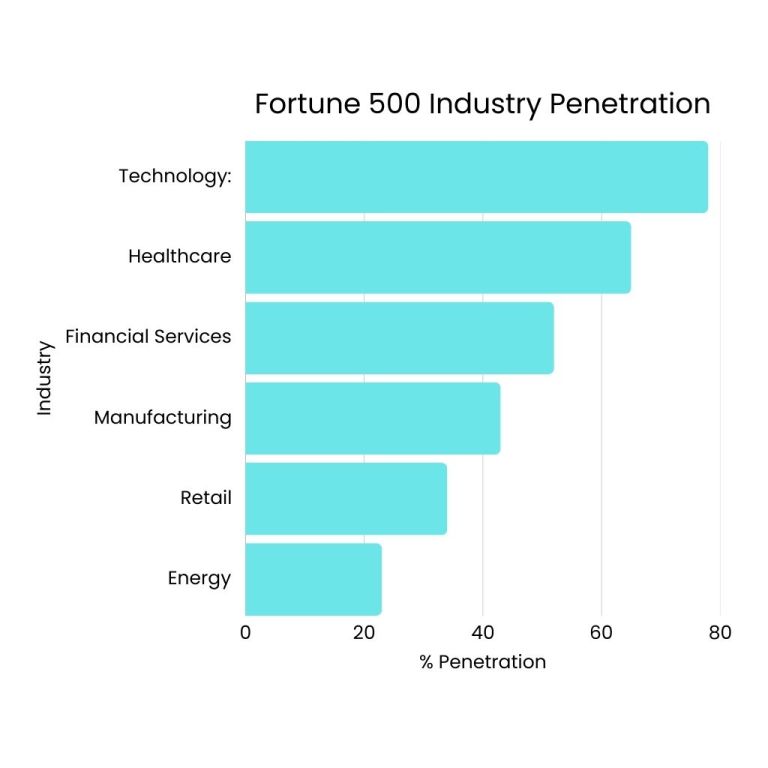
Fortune 500 Penetration Analysis
"What impressed me most was their systematic approach to everything—from SEO to LinkedIn outreach to personal branding. Every strategy was backed by data, every campaign had clear success metrics, and every month showed measurable progress toward our IPO goals. The appointment setting process alone generated $5.9M in annual revenue."
Scaling Strategy & Future Roadmap
Growth Trajectory Projection
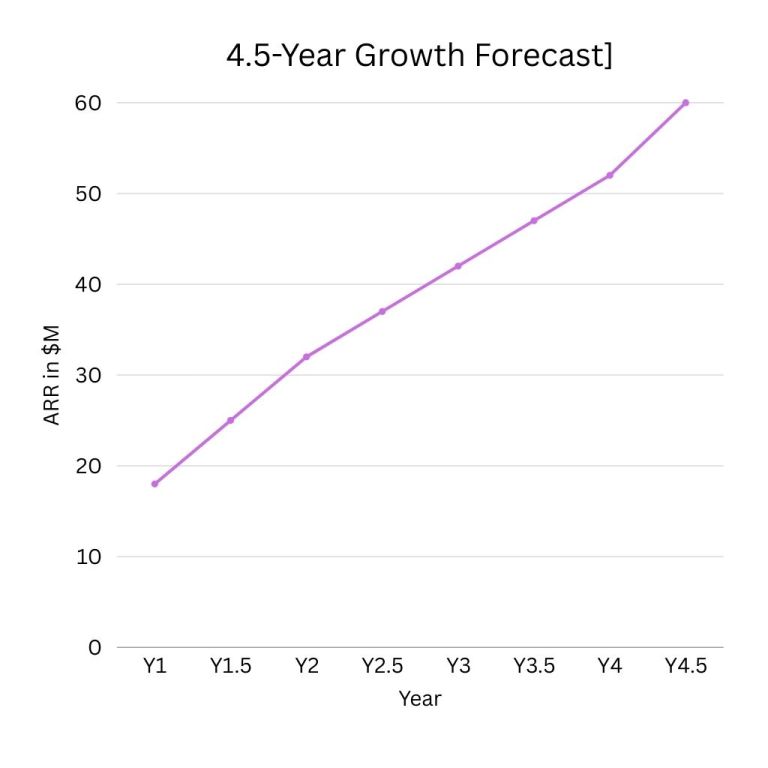
Current: $35.4M ARR → Projected: $60M ARR (69% growth trajectory)
Expansion Strategy Framework
- Q1 2024: European market expansion (+40% TAM)
- Q2 2024: Enterprise product tier launch
- Q3 2024: Strategic partnership with Salesforce
- Q4 2024: IPO preparation marketing campaign
- Q1 2025: International SEO optimization (5 languages)
- Q2 2025: Account-based marketing for Fortune 100
Key Success Factors & Replicable Framework
The B2B SaaS Growth Formula
Critical Success Elements
- Technical Excellence First: Site speed and SEO foundation before traffic generation
- Authority-Based Content Strategy: Long-form, research-backed content that positions as thought leader
- Precision Targeting: Focus on enterprise decision-makers, not just lead volume
- Executive Personal Branding: CEO/CMO thought leadership driving direct revenue
- LinkedIn Outreach Engine: Systematic approach to Fortune 500 decision-makers
- Sales-Marketing Alignment: Unified metrics and shared accountability for revenue
- Continuous Optimization: Weekly testing and refinement across all channels
Replication Requirements
For Similar B2B SaaS Success:
- Minimum Viable Budget: $217K/month for 12-month engagement
- Content Investment: 40+ hours/month of subject matter expert time
- Technical Resources: Development team for site optimization
- Sales Collaboration: Weekly alignment meetings and shared CRM access
- Executive Buy-in: CEO/CMO participation in strategic planning and personal branding
Competitive Intelligence Insights
Market Disruption Analysis
TABLE: Competitive Response Tracking
Why This B2B SaaS Success Is Replicable
The Xceed Systematic Advantage
This transformation represents more than marketing success—it’s business engineering.
Our Business Goal-Oriented Sales & Marketing System doesn’t depend on luck, trends, or individual heroics. It’s a methodical process that transforms unknown SaaS companies into market leaders through:
- Technical Foundation Excellence
- Authority-Driven Content Strategy
- Precision Enterprise Targeting
- Executive Personal Branding
- LinkedIn Outreach Mastery
- Conversion-Optimized Sales Enablement
- Continuous Data-Driven Refinement
If you’re ready to move beyond disconnected tactics and partner with an agency that provides a complete, Business Goal-Oriented Sales & Marketing System, let’s talk.