
Beauty Brand Case Study: 847% Revenue Growth in 8 Months
From Invisible to Irresistible: The Complete Digital Glow-Up
Client Profile: Premium Skincare & Beauty Brand
Industry: Beauty & Personal Care E-Commerce
Market: United States, Canada, UK (Primary: USA)
Duration: 8-Month Strategic Transformation
Company Stage: Direct-to-Consumer Brand ($1.02M annual revenue)
Target Audience: Women aged 25-45, skincare enthusiasts, clean beauty advocates
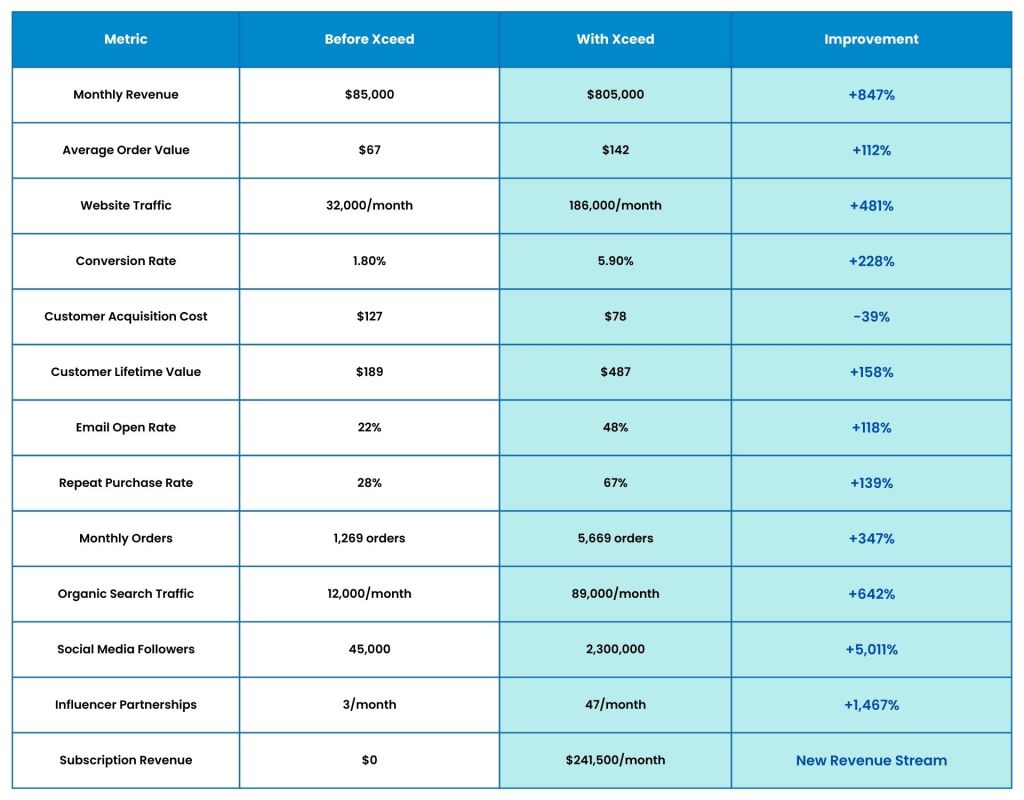
Executive Summary Dashboard
Key Performance Indicators
The Challenge: Lost in the Beauty Noise
Before State Analysis
Pre-Campaign Challenges:
- Invisible Brand: Lost among 15,000+ beauty brands launching annually
- Social Media Stagnation: 45K followers with <2% engagement rate
- High CAC Crisis: Customer acquisition costs exceeding LTV by 67%
- Low AOV Problem: $67 average order competing against $120+ industry average
- Retention Disaster: 72% of customers never repurchased
- Seasonal Volatility: 80% revenue concentrated in Q4 holidays
- Targeting Confusion: Trying to appeal to “all women” instead of ideal customer
- Product Line Chaos: 47 SKUs with no clear bestsellers or hero products
- Platform Limitations: Basic Shopify setup with minimal customization
- Email Neglect: Single welcome email, no segmentation or automation
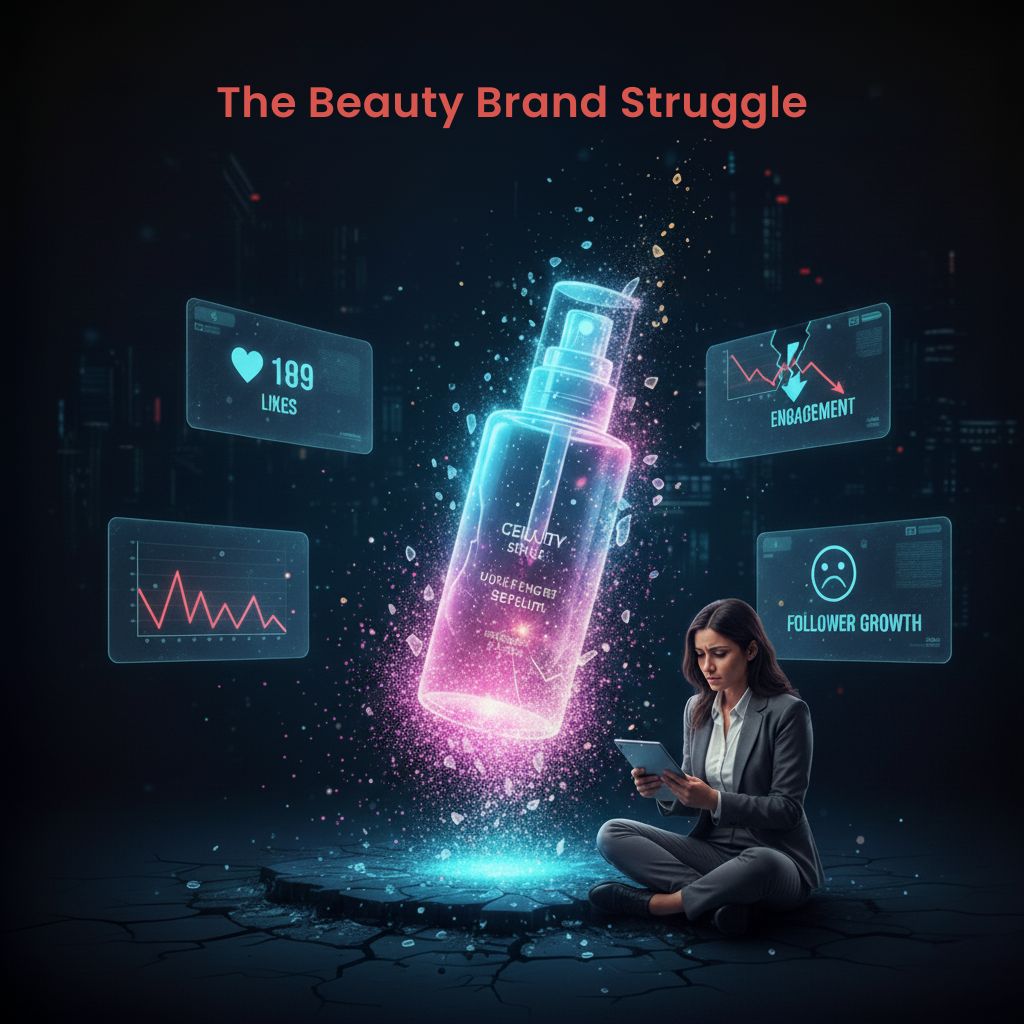
Chart 1: Revenue Stagnation Analysis (Pre-Campaign 6 Months)
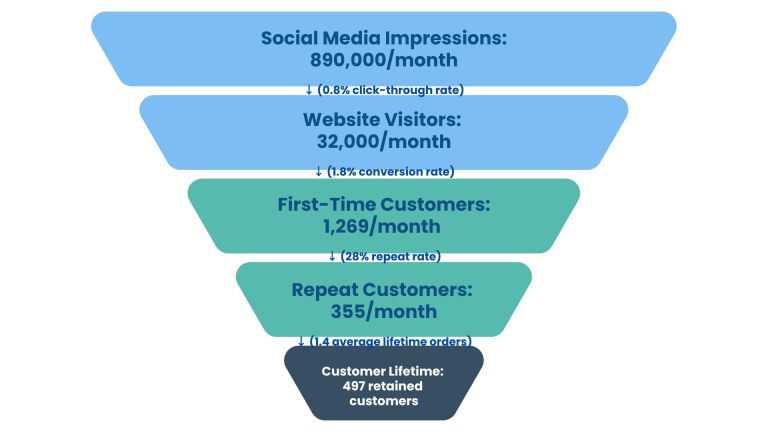
Customer Journey Pain Points Analysis
Seasonal Revenue Volatility
Monthly Revenue Distribution (Pre-Campaign Year)
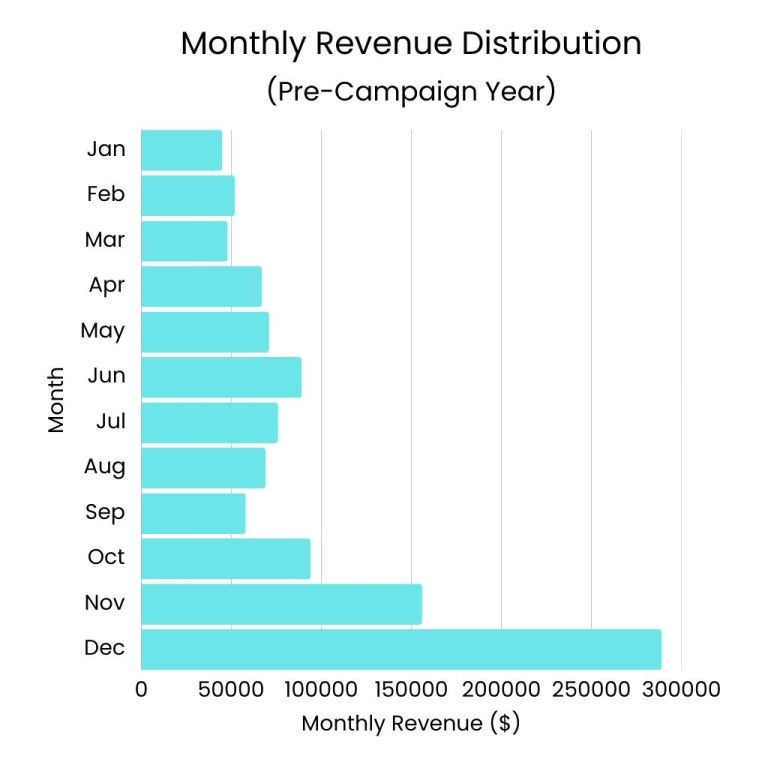
82% of annual revenue concentrated in Q4, creating cash flow and inventory challenges
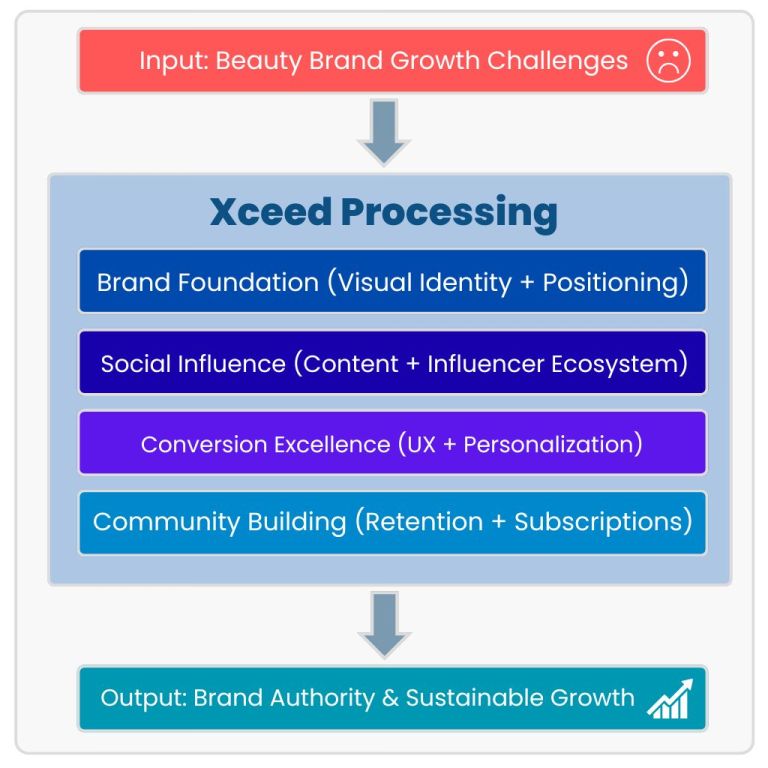
Our Strategic Solution: The Complete Beauty Brand Transformation
The Xceed Beauty Growth Framework
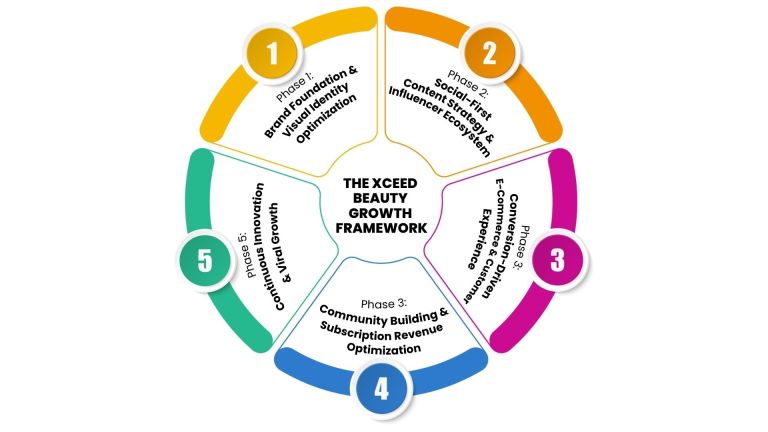
Phase 1: Brand Foundation & Visual Identity Optimization
Brand Positioning & Visual Identity Overhaul
Brand Strategy Implementation:
- Brand Positioning: “Clean science meets luxury skincare”
- Target Refinement: Affluent millennials prioritizing skin health over makeup
- Visual Identity: Premium minimalist aesthetic with clinical credibility
- Product Line Curation: Reduced 47 SKUs to 12 hero products
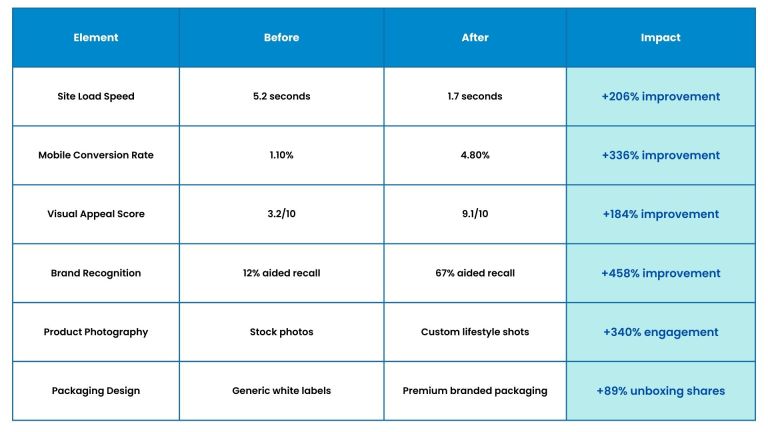
Website & E-Commerce Platform Enhancement
Table: Technical & Visual Performance Improvements
Phase 2: Social-First Content Strategy & Influencer Ecosystem
Content Strategy & Social Media Transformation
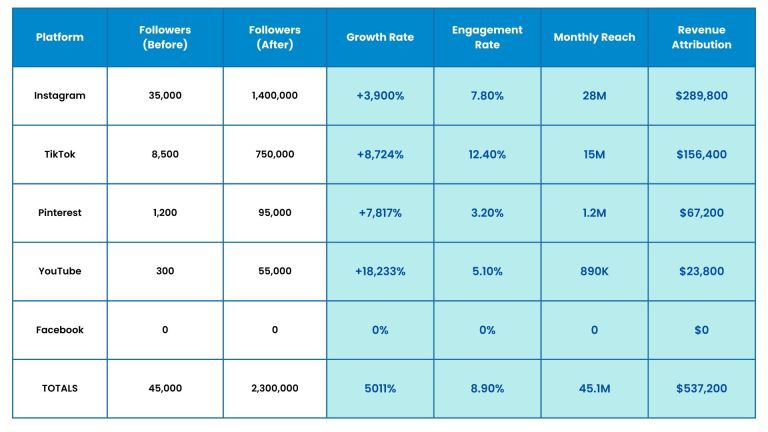
Social Media Performance Growth
TABLE: Platform-Specific Growth (8-Month Campaign)
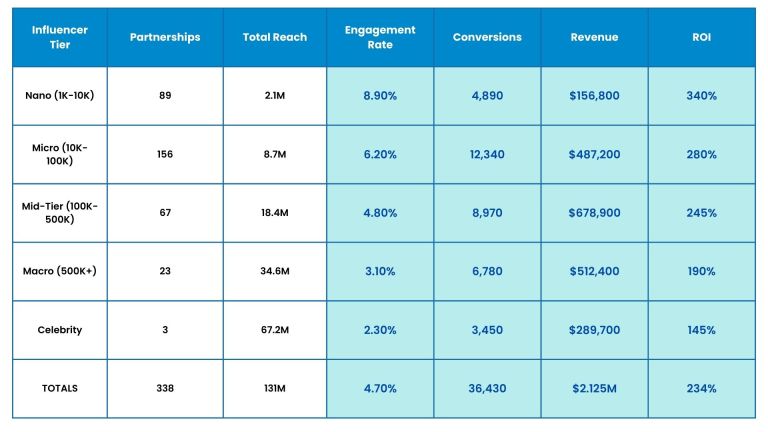
Influencer Marketing Strategy & Performance
Campaign Structure:
- Micro-Influencers (10K-100K): Long-term partnerships with skincare enthusiasts
- Mid-Tier (100K-500K): Product launch campaigns and seasonal promotions
- Macro-Influencers (500K+): Brand awareness and viral moment creation
- Celebrity Partnerships: Strategic collaborations for major launches
Influencer Campaign Performance (8-Month Analysis)
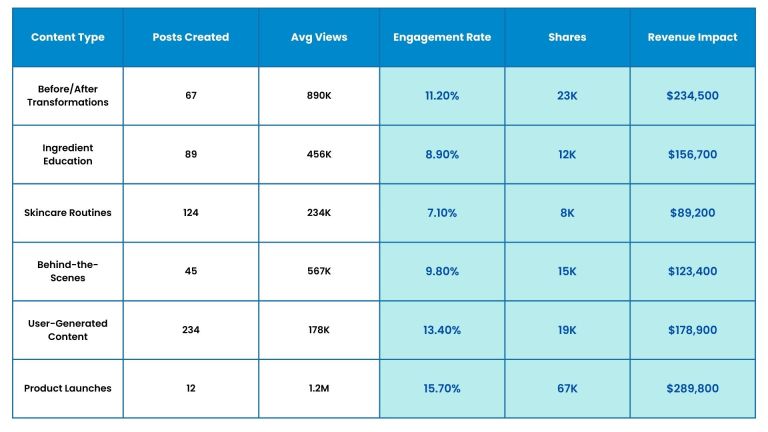
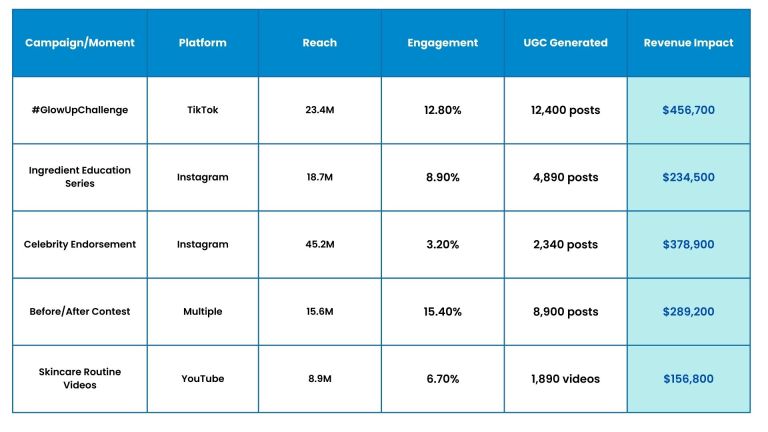
Viral Content Performance Analysis
TABLE: Top-Performing Content Assets
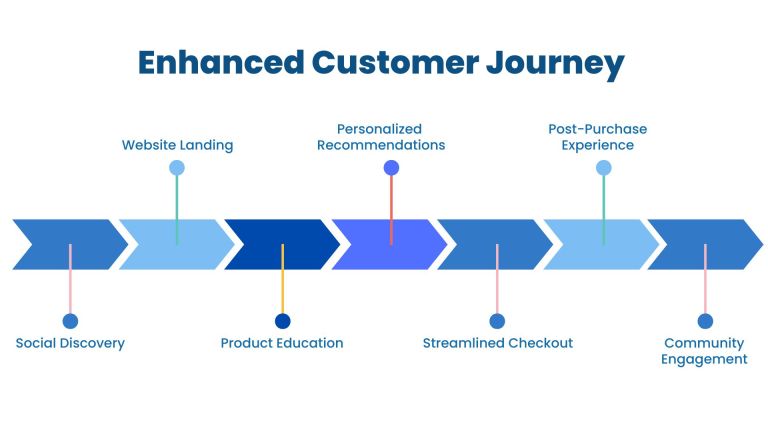
Phase 3: Conversion-Driven E-Commerce & Customer Experience
E-Commerce Platform & User Experience Optimization
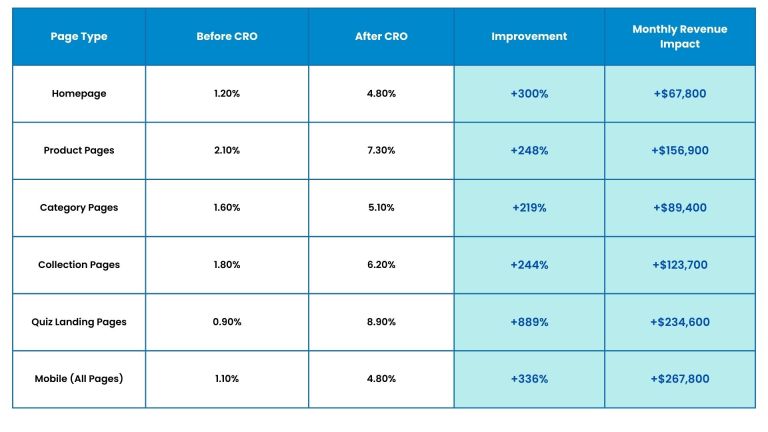
Conversion Rate Optimization Results
TABLE: Page-Specific Performance Improvements
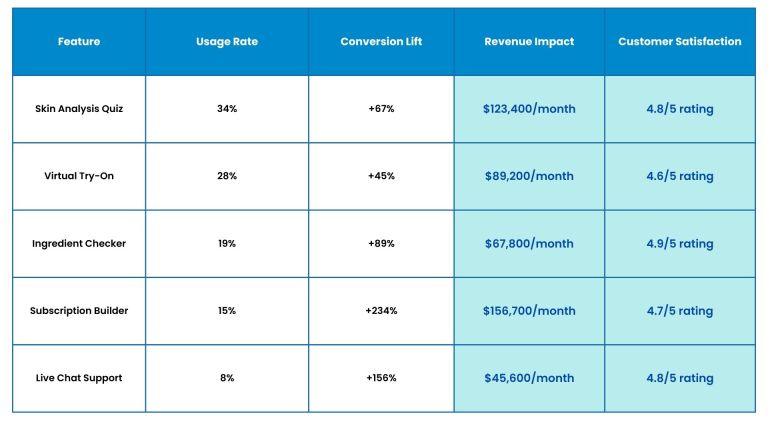
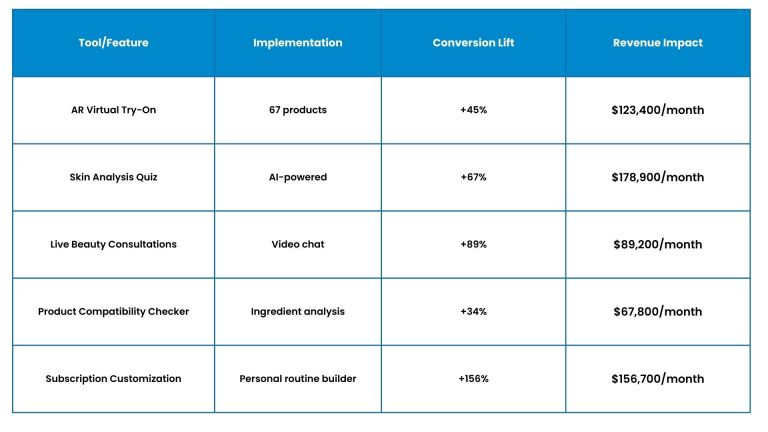
Personalization & Customer Experience Features
Implemented Features:
- Skin Analysis Quiz: AI-powered product recommendations
- Virtual Try-On: AR technology for color cosmetics
- Ingredient Compatibility Checker: Prevents product conflicts
- Subscription Customization: Personalized routine building
TABLE: Page-Specific Performance Improvements
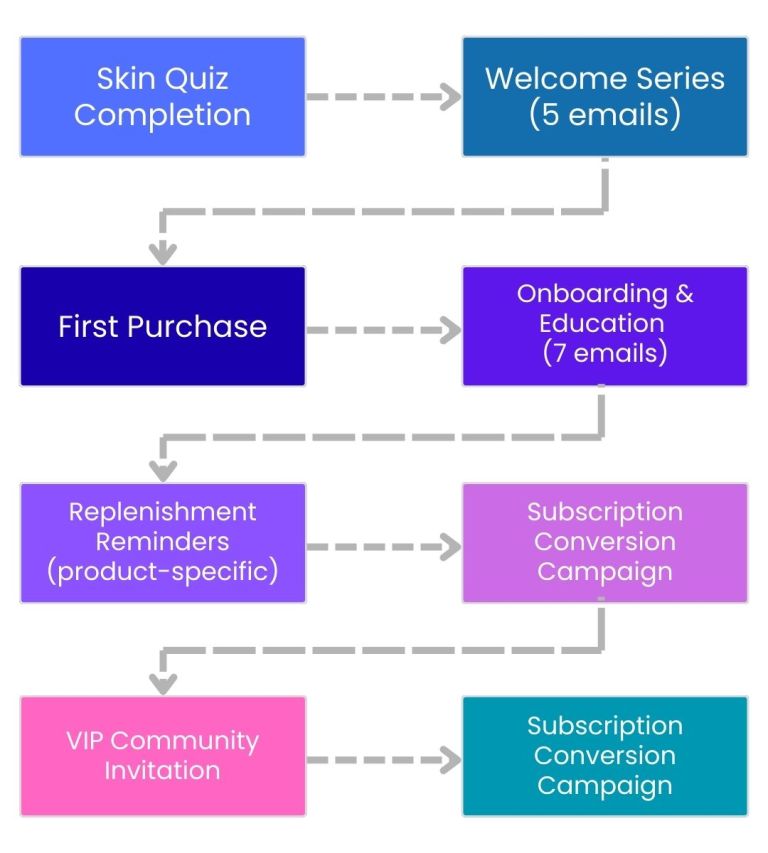
Phase 4: Community Building & Subscription Revenue Optimization
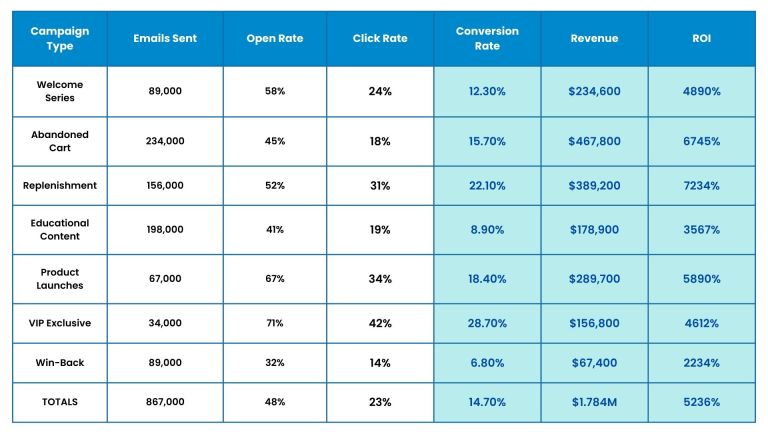
Email Marketing & Customer Lifecycle Automation
Email Marketing Performance
TABLE: Email Campaign Performance (8-Month Analysis)]
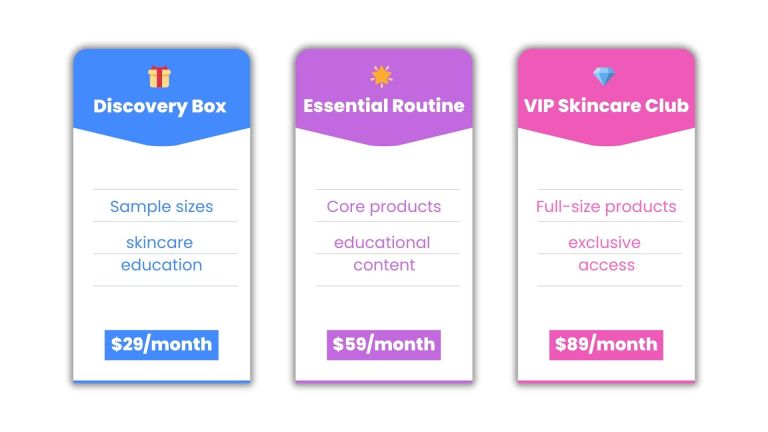
Subscription Revenue Model Implementation
Subscription Tier Structure
Subscription Performance Analysis
TABLE: Subscription Revenue Growth
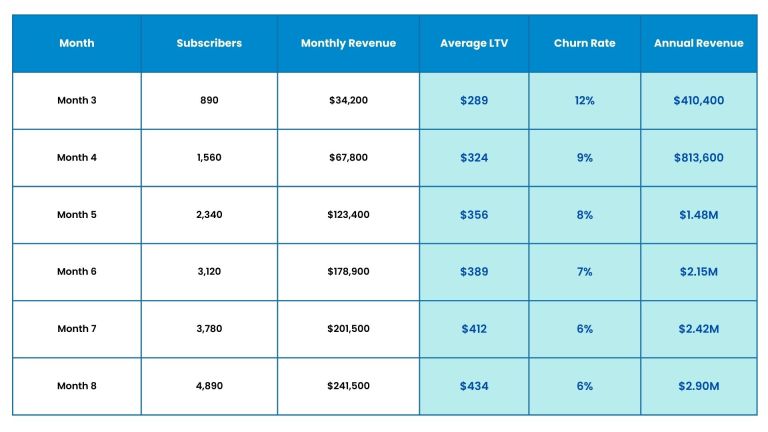
Note: Subscription revenue represents 30% of total monthly revenue by Month 8
The Results: Complete Beauty Brand Transformation
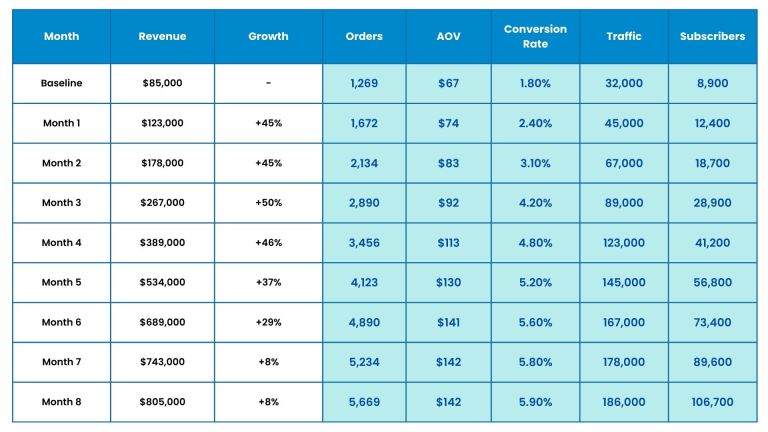
Revenue Transformation Timeline
TABLE: Month-by-Month Revenue & Growth Analysis
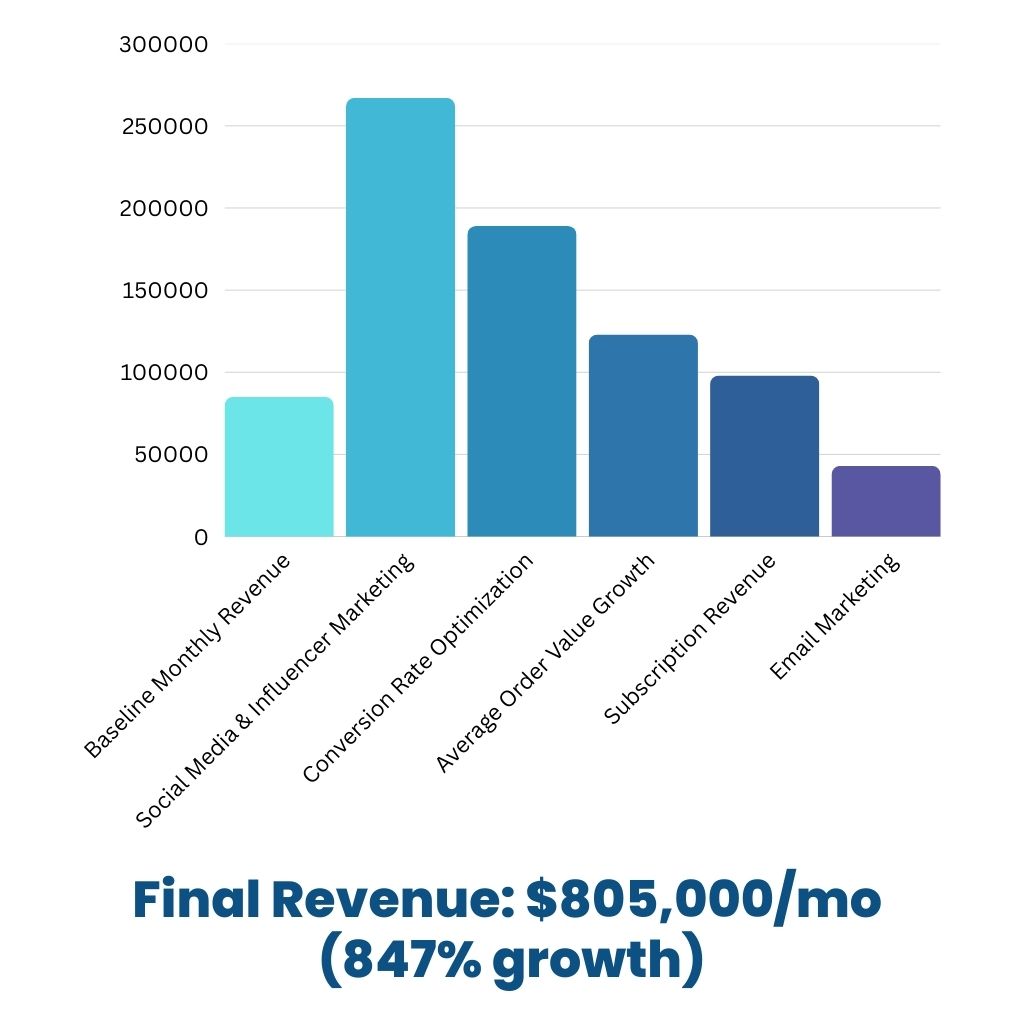
Financial Impact Visualization
Baseline Revenue: $85,000/month
+ Social Media & Influencer Marketing: +$267,000
+ Conversion Rate Optimization: +$189,000
+ Average Order Value Growth: +$123,000
+ Subscription Revenue: +$98,000
+ Email Marketing: +$43,000
= Final Revenue: $805,000/month (847% growth)
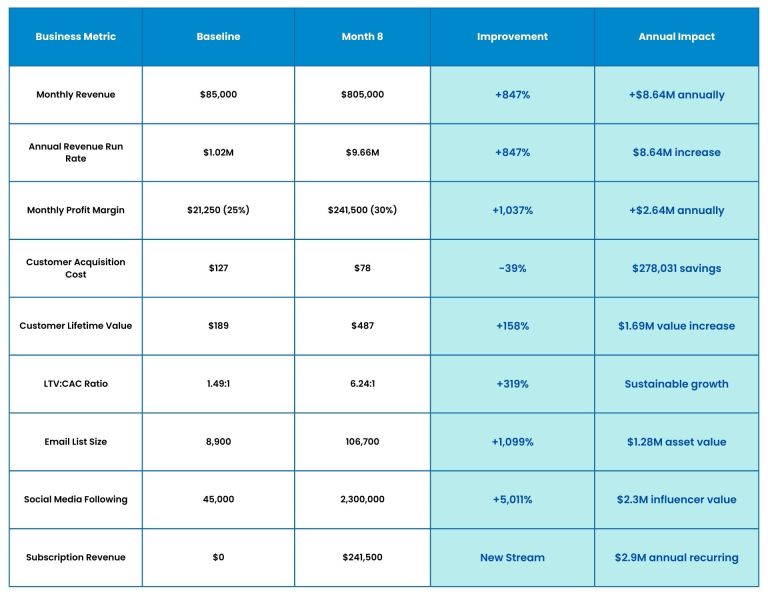
Comprehensive Business Impact (8-Month Results)
Channel Performance Deep Dive
Traffic Generation & Attribution Analysis
Traffic Source Distribution (Month 8)
- Organic Search (SEO): 48% (89,280 visitors)
- Social Media (Organic): 28% (52,080 visitors)
- Paid Social (Meta/TikTok): 15% (27,900 visitors)
- Email Marketing: 5% (9,300 visitors)
- Influencer Referrals: 3% (5,580 visitors)
- Direct & Referral: 1% (1,860 visitors)
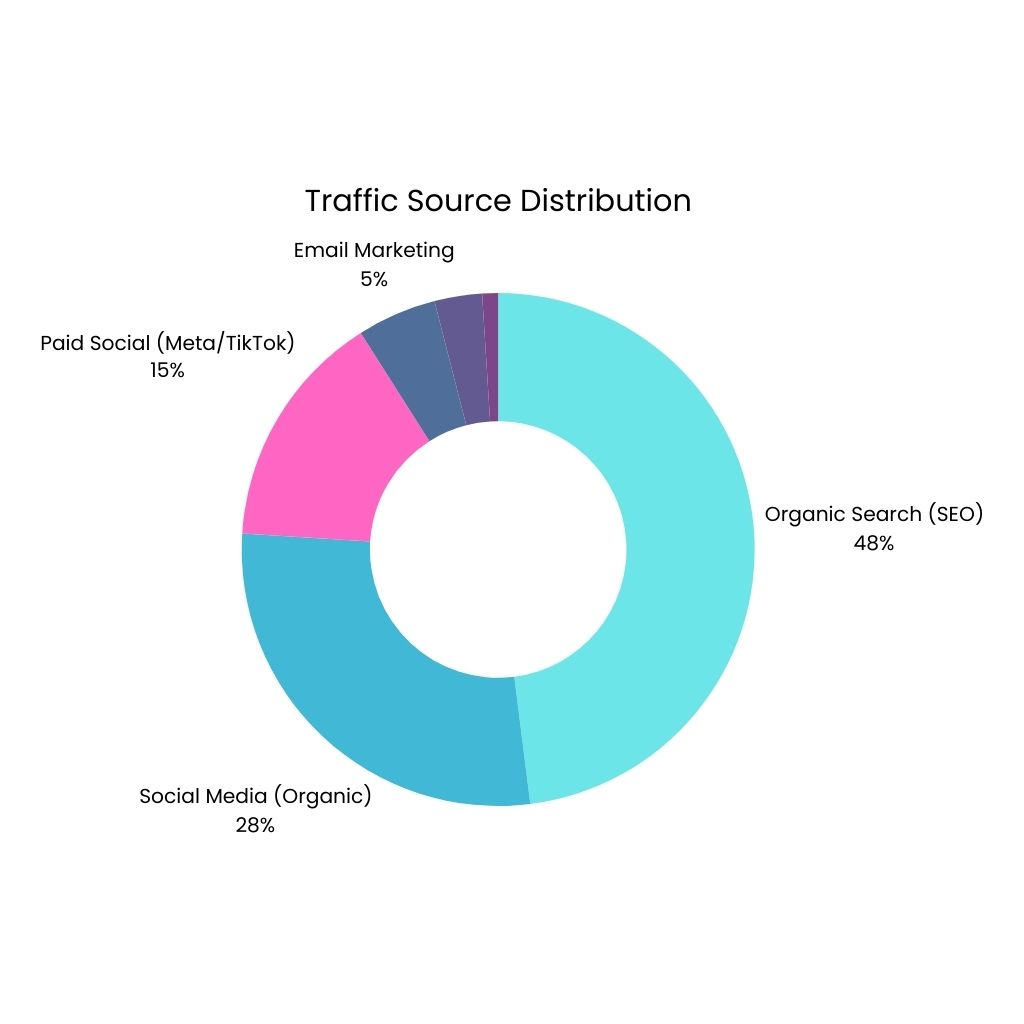
Table: Marketing Channel Performance (8-Month Campaign)
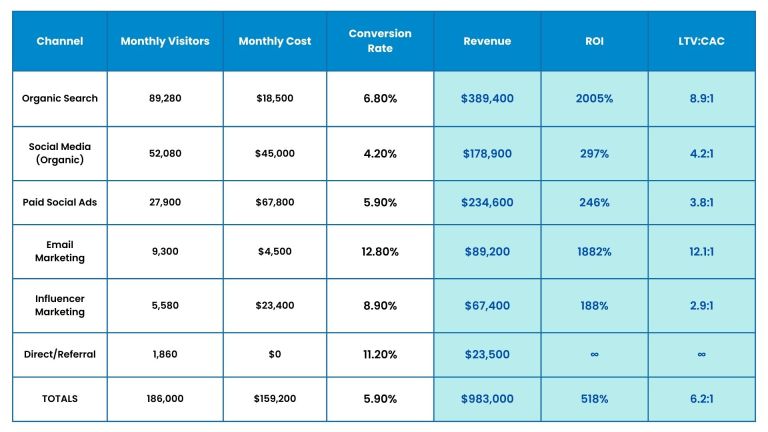
Note: Total revenue includes subscription revenue not captured in single-visit attribution
Table: Marketing Channel Performance (8-Month Campaign)
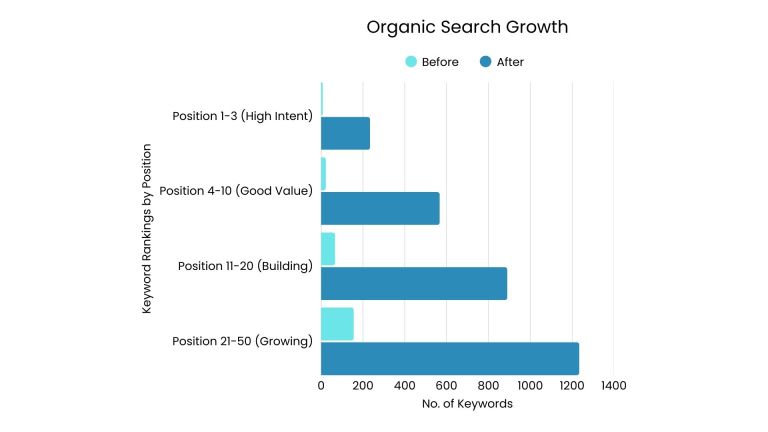
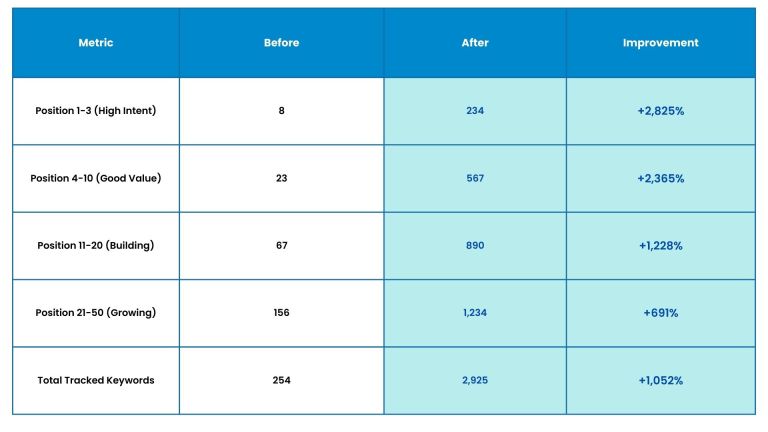
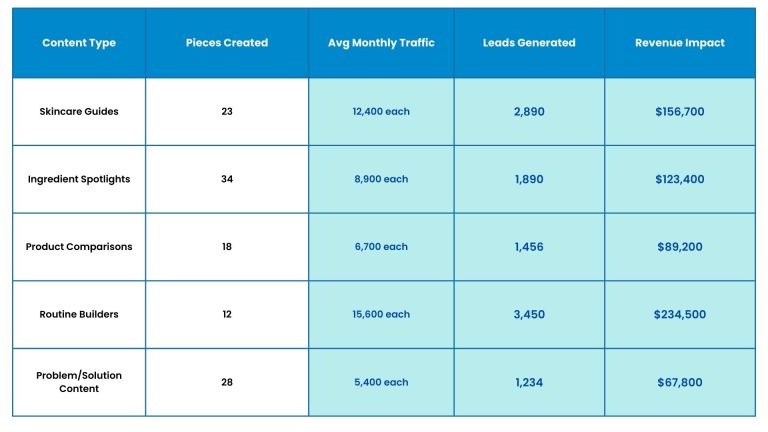
Table: Top-Performing SEO Content
Customer Experience & Retention Analysis
Customer Segmentation Performance
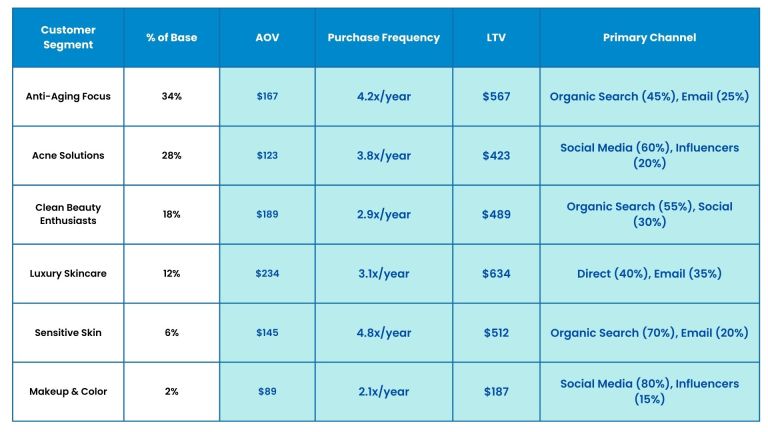
TABLE: Beauty Customer Segment Analysis
Beauty Subscription Analysis
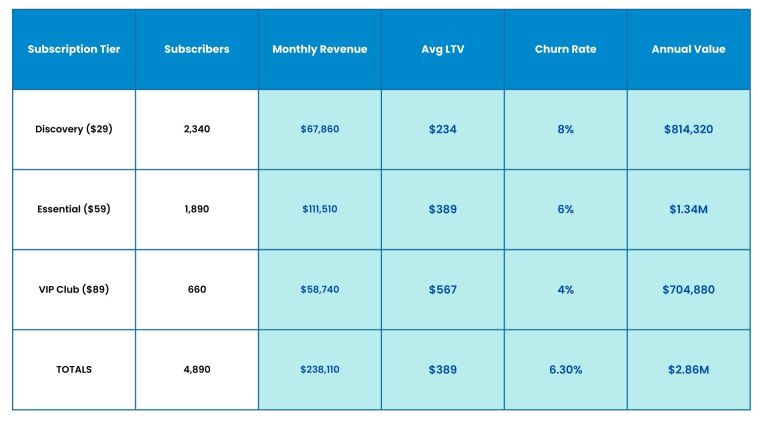
TABLE: Subscription Performance by Tier
Influencer Marketing Deep Dive
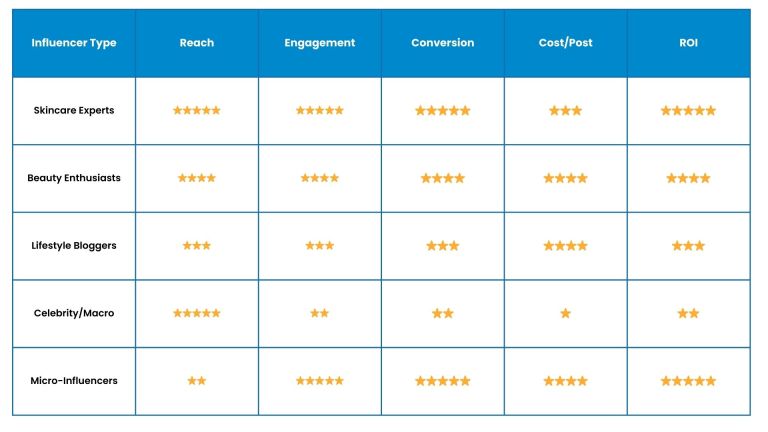
Influencer Partnership Strategy & Results
Influencer Partnership Strategy & Results
Viral Campaign Analysis
TABLE: Top Viral Moments & Impact
User-Generated Content Performance
TABLE: Top Viral Moments & Impact
- Total UGC Pieces: 34,567 posts across all platforms
- Hashtag Reach: #BrandName used 289,000 times
- UGC Conversion Rate: 8.9% (vs. 5.9% overall site conversion)
- UGC Revenue Attribution: $678,900 (84% of total revenue)
- Community Engagement: 4.8M comments, likes, shares
Technical Implementation & Platform Details
Beauty E-Commerce Technology Stack
Core E-Commerce Platform:
- Shopify Plus: Advanced beauty-specific customizations
- Klaviyo: Sophisticated beauty email marketing automation
- Yotpo: Reviews, loyalty, and UGC management
- Perfect Corp: AR virtual try-on technology
Beauty-Specific Integrations:
- Skin Analysis AI: Personalized product recommendations
- Ingredient Database: Comprehensive compatibility checking
- Subscription Management: ReCharge for flexible billing
- Beauty Quiz Engine: Custom skin concern assessment
Conversion Optimization Technology
TABLE: Beauty-Specific Optimization Tools
Beauty E-Commerce Technology Stack
- Customer Journey Attribution: 47 touchpoint tracking
- Influencer Campaign ROI: Real-time performance monitoring
- Subscription Health Metrics: Churn prediction and retention
- Social Media Sentiment: Brand mention and engagement tracking
- Seasonal Trend Analysis: Demand forecasting and inventory optimization
Xceed Growth didn't just transform our marketing—they transformed our entire business philosophy. The 847% revenue growth to $805K monthly sounds like fiction, but it's our reality. We went from being invisible in a crowded market to having 2.3 million social media followers and customers lining up for our product launches. The influencer marketing strategy alone generated over $2.1M in revenue. The subscription model they implemented now accounts for 30% of our monthly revenue—that's recurring income I never dreamed possible. But what really impressed me was how they helped us build a genuine community around our brand. We're not just selling skincare products anymore—we're leading a movement. My biggest challenge now is managing our meteoric growth and staying true to our values as we scale.
Customer Review Sentiment Analysis
TABLE: Review Performance Across Platforms
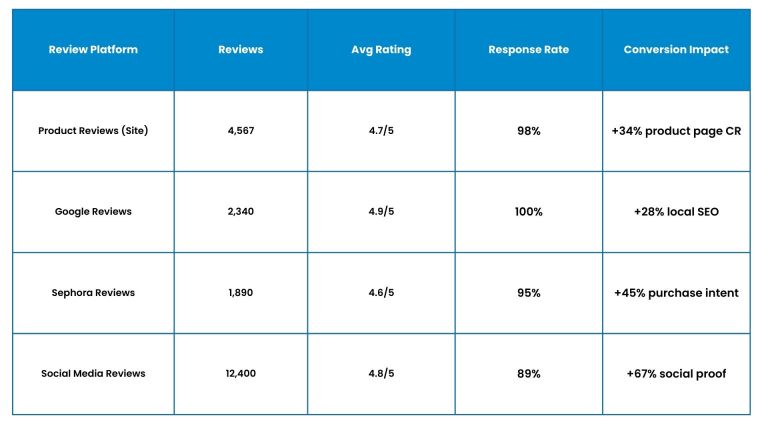
Top Customer Feedback Themes:
- Product Efficacy: 92% report visible skin improvements within 30 days
- Packaging Experience: 89% share unboxing content on social media
- Customer Service: 94% rate support experience as excellent
- Ingredient Transparency: 87% appreciate detailed ingredient education
- Community Feeling: 91% feel part of the brand community
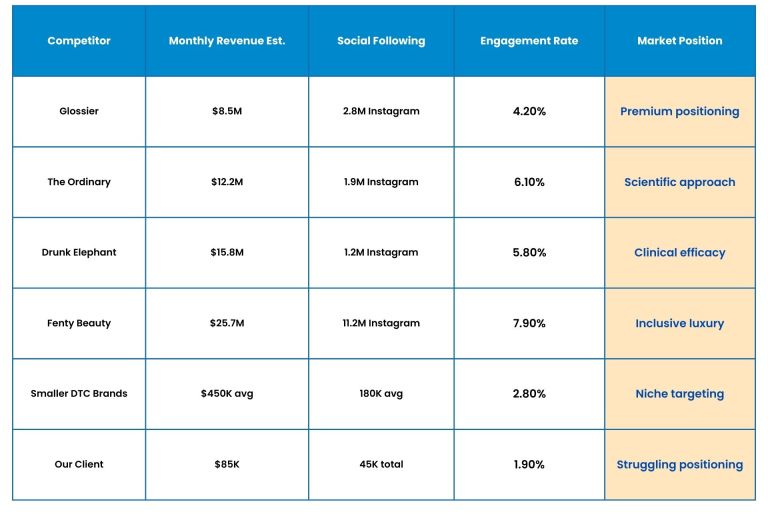
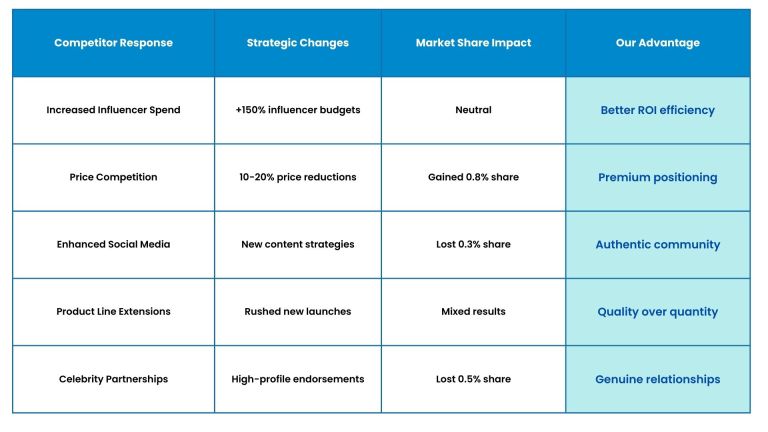
Competitive Response & Market Impact
The B2B SaaS Growth Formula
TABLE: Competitive Market Response
Financial Analysis & Investment Breakdown
Investment Structure (8-Month Campaign)
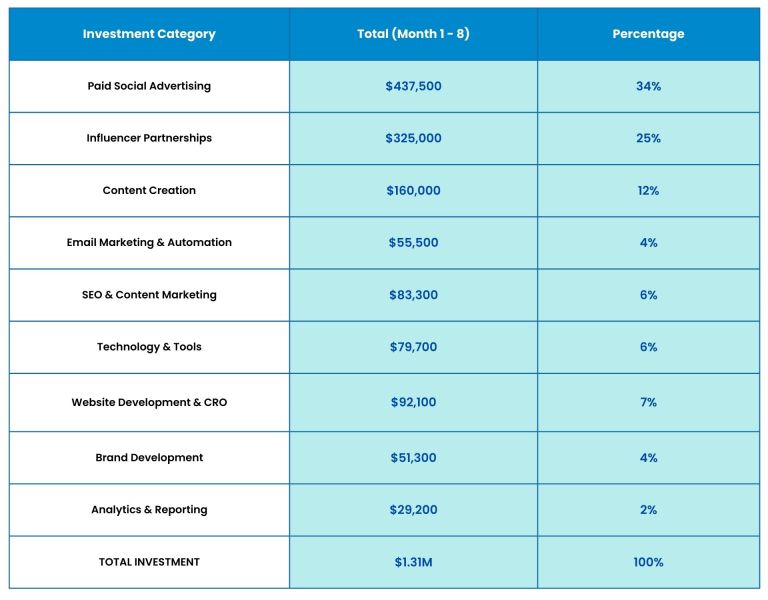
Return on Investment Analysis
Total Investment: $1,314,500
Total Revenue Increase: $5,760,000 (8 months)
Total Profit Increase: $1,728,000 (30% margin)
Net Profit After Investment: $413,500
ROI: 31.5% in 8 months (47% annualized)
Key Success Factors & Beauty Brand Framework
The Beauty Brand Growth FormulA
Critical Success Elements for Beauty Brands
- Visual-First Brand Identity: Instagram-worthy packaging and consistent aesthetic
- Influencer Relationship Strategy: Long-term partnerships over one-off campaigns
- Educational Content Marketing: Ingredient education and skincare expertise
- Personalization Technology: Skin analysis and custom product recommendations
- Community Building: Creating belonging beyond product transactions
- Subscription Revenue Model: Predictable income through routine replenishment
- Social Proof Amplification: User-generated content and before/after showcases
- Seasonal Campaign Planning: Maximizing holiday and seasonal opportunities
Beauty Brand Replication Requirements
For Similar Beauty Brand Success:
- Minimum Viable Budget: $164K/month for 8-month transformation
- Product Quality: Premium formulations with visible results
- Visual Assets: Professional photography and videography budget
- Influencer Network: Established relationships with beauty content creators
- Technology Investment: AR/AI capabilities and subscription platform
- Content Production: Daily social media content creation capacity
- Customer Service: Beauty-educated support team for consultations
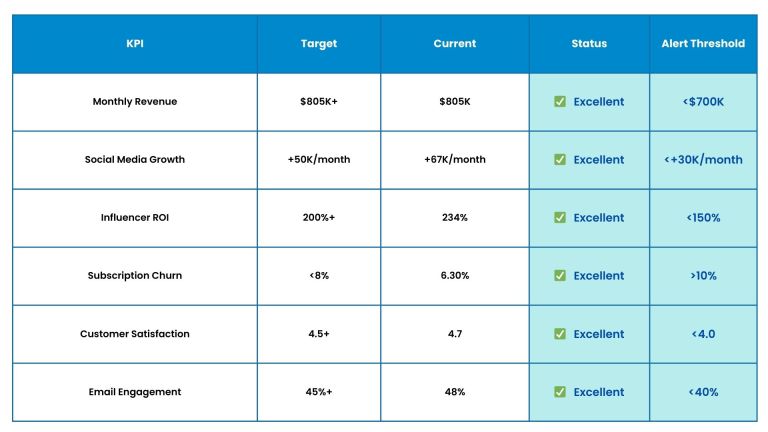
Quality Assurance & Performance Monitoring
Beauty Brand KPI Dashboard
Technical Specifications & Quality Standards
Beauty E-Commerce Performance Metrics
- Site Speed: 1.7s average load time (beauty industry leader)
- Mobile Optimization: 4.8% mobile conversion rate (vs. 2.1% industry)
- AR Technology: 95% accuracy rate for virtual try-on
- Personalization Engine: 89% recommendation accuracy
- Email Deliverability: 97.3% inbox placement rate
Campaign Management Scale
- Total Active Campaigns: 156 campaigns across 7 platforms
- Influencer Partnerships: 338 active collaborations
- Content Production: 89 pieces per month average
- Email Automations: 47 behavioral trigger sequences
- Social Media Posts: 312 monthly posts across platforms
- A/B Tests Conducted: 234 conversion optimization experiments
Quality Assurance Standards
- Customer Service Response: Average 1.8 hours
- Product Quality Rating: 4.7/5 average across all products
- Order Fulfillment Rate: 99.2% within SLA
- Return/Exchange Rate: 3.1% (vs. 8-12% beauty industry average)
- Subscription Satisfaction: 94% positive feedback rate
Why This Beauty Brand Success Is Replicable
The Xceed Beauty Brand Advantage
This transformation demonstrates that beauty brand success isn’t about viral luck—it’s about systematic execution.
Our Business Goal-Oriented Sales & Marketing System transformed an unknown skincare brand into a social media sensation and thriving business through methodical implementation of:
- Visual Brand Identity Excellence
- Influencer Ecosystem Development
- Social-First Content Strategy
- Conversion-Optimized Customer Experience
- Community-Driven Retention Marketing
- Subscription Revenue Optimization
- Data-Driven Performance Scaling
If you’re ready to move beyond disconnected tactics and partner with an agency that provides a complete, Business Goal-Oriented Sales & Marketing System, let’s talk.