
- Home
- Growth Marketing
- A Guide to Growth Marketing Metrics That Matter
Your Ultimate Guide to Growth Marketing Metrics

Let’s be honest.
You’re spending a significant amount of your budget on marketing.
You see the activity—the clicks, the traffic, the social media buzz.
But when your CEO or a board member looks you in the eye and asks, “Is this actually working? What’s our return on all this?”—do you have an answer that makes you feel confident?
If you feel that familiar knot in your stomach, take a deep breath. You’re not alone.
I’ve worked with founders and marketing VPs for over 13 years.
I see the same challenge again and again.
They have endless data but very few real answers.
They track everything but can’t connect their work to the one thing that matters: profitable growth.
This is not another list of fifty marketing acronyms.
This is your new playbook.
My goal is to give you a simple framework for the growth marketing metrics that will make a real difference.
We will cut through the noise and build a system that gives you clarity.
TL;DR:
KPIs vs. Metrics: All KPIs are metrics, but not all metrics are KPIs. KPIs are the few numbers directly tied to your business goals (like ETA on a road trip).
Focus on Business Health: Your most important growth marketing metrics are strategic: Customer Lifetime Value (LTV), Customer Acquisition Cost (CAC), and Media Efficiency Ratio (MER). A healthy LTV:CAC ratio (aim for 3:1) is essential.
Tiered Dashboards are Key: Executives need a high-level view (LTV:CAC, MER). Your marketing team needs granular, daily metrics (CTR, CPC) to optimize campaigns. Don’t show everyone the same report.
Quality Over Quantity: Stop chasing cheap leads. Focus on the Cost per Sales Qualified Lead (SQL) to align marketing efforts with actual sales results and profitable growth.
Let’s get started.
The Executive KPIs: Measuring What Matters Most
This is the high-level view.
These are the numbers for your board meeting.
They show if your marketing is truly working for the business.
KPI vs. Metric: What’s the Real Difference?
People often mix these terms up, but the difference is simple and important.
Think about taking a road trip.
Metrics are all the data points on your dashboard. Your speed, engine temperature, and tire pressure are all metrics.
KPIs (Key Performance Indicators) are the few numbers that tell you if you’ll reach your goal. Your ETA and your Fuel Level are the KPIs for this trip.
You track many metrics, but you focus on a few KPIs.
Your team looks at dozens of metrics. As a leader, you need to focus on the handful of KPIs that signal the health of the business.
Your “North Star” KPIs: The 3-5 Most Important Numbers
If you could only have one dashboard, what would be on it?
These are your “North Star” growth marketing metrics.
They show the core value customers get from you and predict future income.
Here are some great examples:
Spotify: Time spent listening.
Airbnb: Number of nights booked.
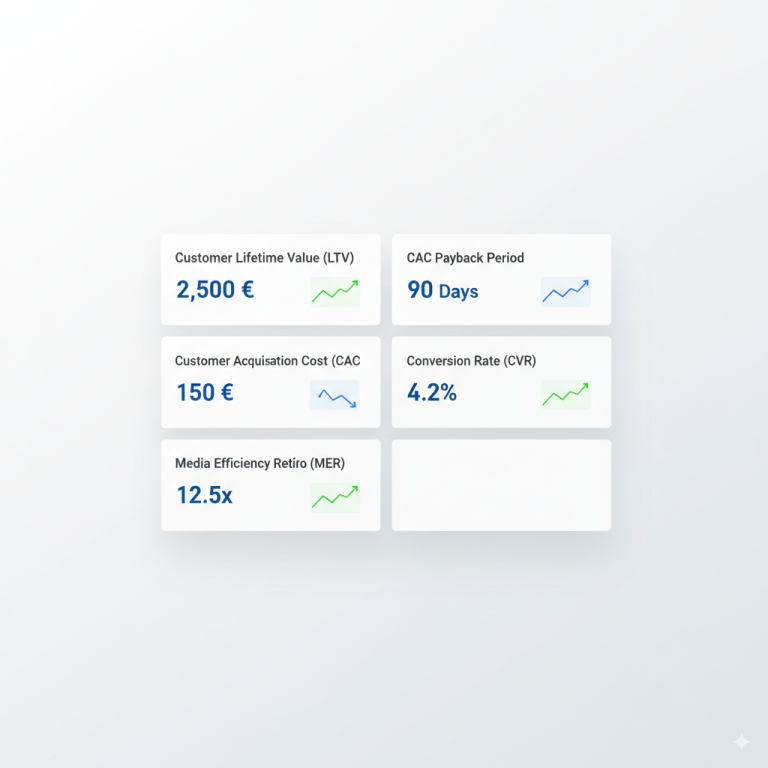
For most companies, the story is told through these five KPIs:
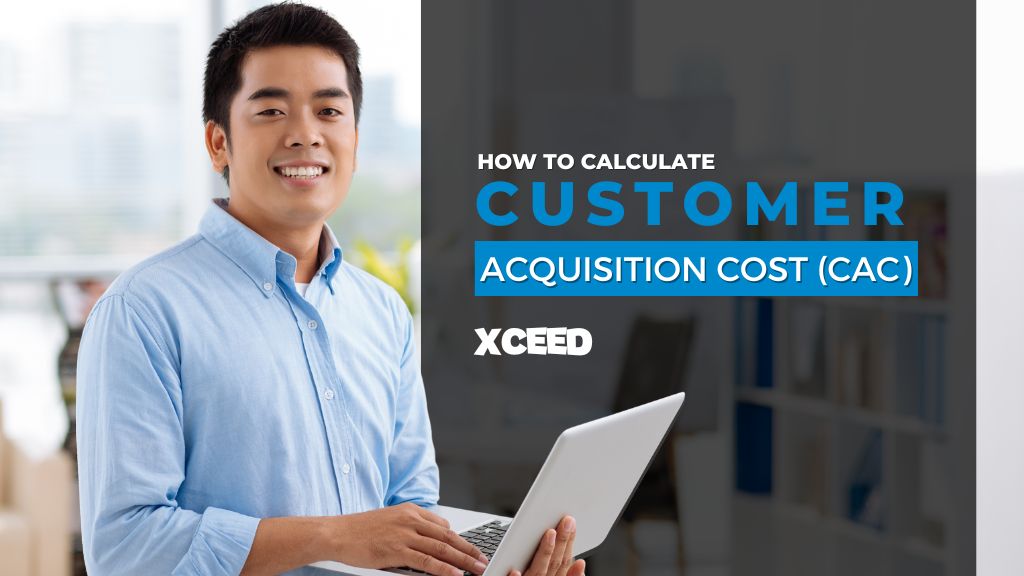
Customer Acquisition Cost (CAC): What is our total cost to get a new paying customer?
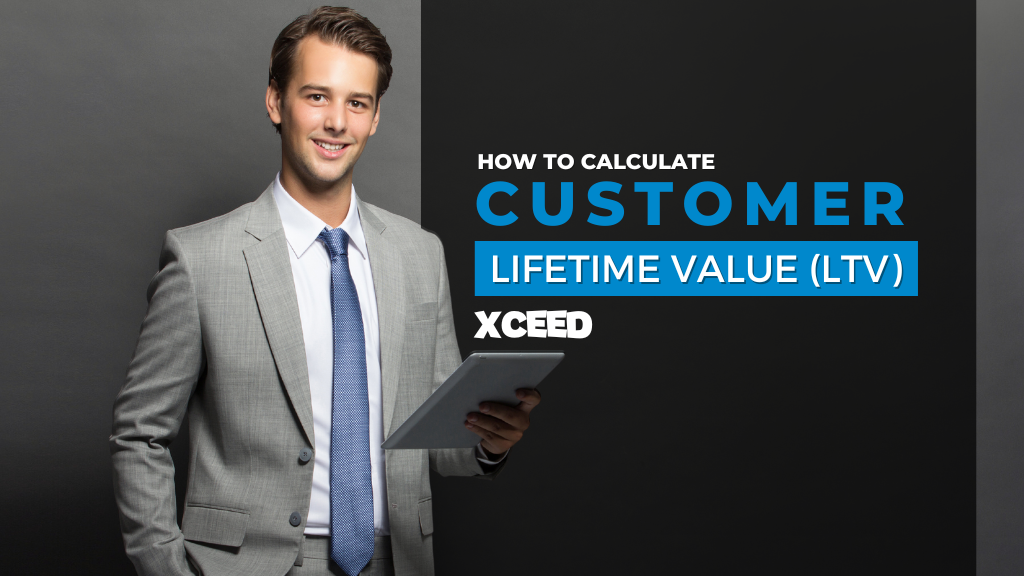
Customer Lifetime Value (LTV): How much total profit will a customer bring us over their entire time with us?
Media Efficiency Ratio (MER): For every dollar we put into ads, how many dollars in total revenue do we get back?
CAC Payback Period: How many months does it take to earn back the money we spent to get a customer?
Conversion Rate (CVR): What percentage of people take the main action we want them to take?
For most companies, the story is told through these five KPIs:
Customer Acquisition Cost (CAC): What is our total cost to get a new paying customer? Click here to learn more about CAC.
Customer Lifetime Value (LTV): How much total profit will a customer bring us over their entire time with us? Click here to learn more about LTV.
Media Efficiency Ratio (MER): For every dollar we put into ads, how many dollars in total revenue do we get back? Click here to learn more about MER.
CAC Payback Period: How many months does it take to earn back the money we spent to get a customer?
Conversion Rate (CVR): What percentage of people take the main action we want them to take?
How to Choose KPIs for Your Business Model
Your main KPI changes based on how your business makes money.
Here is a simple breakdown.
For E-commerce Business
Your focus is on profitable sales.
Media Efficiency Ratio (MER): Your best tool for an honest, big-picture view.

Customer Acquisition Cost (CAC): You must know your cost to acquire a customer.
Average Order Value (AOV): How much do customers spend per transaction?
For B2B Lead Generation
You are starting a relationship, not just making a sale. Quality is key.
Cost per SQL (Sales Qualified Lead): This is your true North Star. How much does it cost to find a lead the sales team is excited about?
Lead-to-Customer Rate: What percentage of leads become actual customers?
For SaaS or Subscription Business
Your business is built on recurring payments. You need customers who stay.
CAC Payback Period: This is vital for your cash flow. How fast do you get your money back on a new user?
Trial-to-Paid Conversion Rate: A direct measure of your product’s value.
Churn Rate: The percentage of customers you lose. You have to keep this number low.
Click here to get marketing benchmark data by industry.
The Team KPIs: Day-to-Day Diagnostic Metrics
Now let’s look at the numbers your team uses every week.
These are the diagnostic metrics.
If your executive KPIs are the “what,” these are the “why.”
If your MER dropped last week, these numbers will tell you the story.
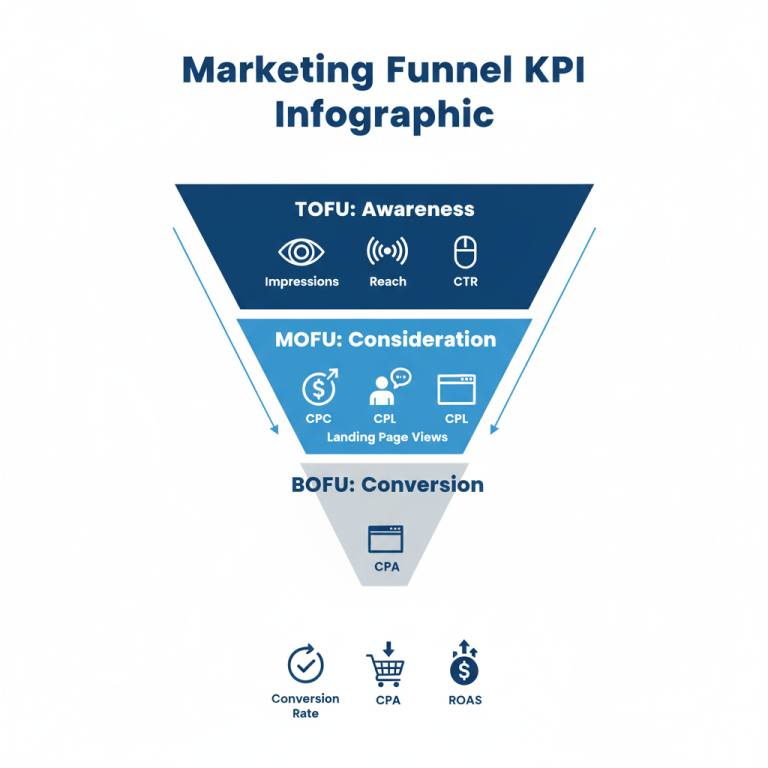
Top of Funnel (ToFu) Metrics: Reaching People
This is about getting your brand in front of the right audience.
Impressions: How many times your ad was shown.
Reach: How many unique people saw your ad.
Frequency: How many times, on average, a person saw your ad.
Cost per Mille (CPM): Your cost for 1,000 ad impressions.
Middle of Funnel (MoFu) Metrics: Gauging Interest
You’ve reached them. Now, do they show interest?
Click-Through Rate (CTR): The percentage of people who saw your ad and clicked. This is a top indicator of good creative and copy.
Cost per Click (CPC): How much you pay for each click.
Video Completion Rate (VCR): Are people watching your whole video? This shows high engagement.
Landing Page Conversion Rate: Of those who click, how many take the next step on your page?
Bottom of Funnel (BoFu) Metrics: Driving Action
This is where you turn interest into new business.
Conversion Rate (CVR): A key measure of your entire funnel’s success.
Cost per Acquisition (CPA): Your cost to get one new customer at the campaign level.
Return on Ad Spend (ROAS): Looked at here on a micro-level (campaign, ad set, ad).
Strategic Metrics: Connecting Marketing to Business Health
This is how you move from being a marketer to a business leader.
It’s about connecting campaign numbers to the company’s financial health.
It’s about answering the question, “So what?”
The LTV:CAC Ratio: Is Your Business Built to Last?
This is arguably the most important of all growth marketing metrics.
The Lifetime Value to Customer Acquisition Cost ratio shows if your business model is sustainable.
A 1:1 ratio means you are losing money.
A 3:1 ratio is widely seen as healthy.
A 5:1 ratio or higher means you have a strong growth engine.
Knowing this ratio helps you set smart budgets. You know exactly how much you can afford to spend to get a new customer.
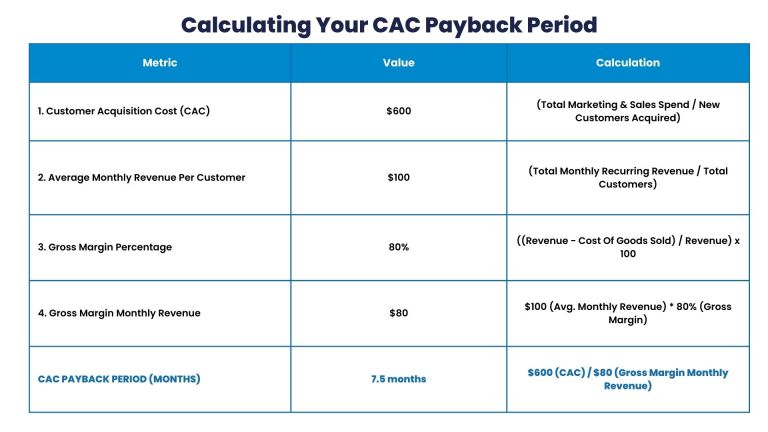
The CAC Payback Period: The Cash Flow Metric
LTV:CAC tells you if you’ll make a profit.
The CAC Payback Period tells you when.
This is the number of months it takes to earn back the cost of acquiring a customer.
This is critical for your cash on hand.
A business can be profitable on paper but fail because it runs out of cash.
For subscription companies, a payback period of less than 12 months is a great goal.
Tackling Real-World Marketing Challenges
Let’s talk about the practical problems that cause the most headaches.
The Attribution Problem
Who gets credit for a sale? The first ad they clicked? The last one?
Stop chasing perfect attribution. It does not exist.
Instead, pick a model that fits your business and use it to watch trends.
Last-Click is the default, but it’s often wrong.
Data-Driven models in Google or Meta are usually your best option.
Your Solution: Use a data-driven model to guide your daily changes. Use MER as your final source of truth for big budget decisions.
Schedule a Free Growth Roadmap Session
It’s a strategic chat, not a sales pitch, designed to give you clarity.
Too Much Data, Not Enough Insight
You need tiered reporting. The right data for the right person.
1. The Executive Dashboard
For: CEO, CFO, Board
Shows: Your 3-5 North Star KPIs.
Viewed: Monthly or Quarterly.
2. The Marketing Lead Dashboard
For: VP/Director of Marketing
Shows: Funnel metrics, budget status, and channel performance.
Viewed: Weekly.
3. The Channel Manager Dashboard
For: Your marketing specialists.
Shows: Detailed daily numbers like CTR, CPC, and Frequency.
Viewed: Daily.
Are We Chasing the Wrong Goals?
It’s easy to reward your team for hitting targets that don’t help the business.
Like getting a lot of cheap, low-quality leads.
Here’s how you build a culture focused on profitable growth.
Reward What Matters: Tie marketing bonuses to Sales Qualified Leads (SQLs). Even better, tie them to the revenue that comes from those leads.
Create Alignment: Your marketing and sales teams must agree on what makes a “qualified lead.” This is the foundation of an efficient system.
Explain the “Why”: Show your team the business numbers. When they understand LTV and CAC, they will stop chasing cheap clicks and start looking for great customers.
Your Action Plan: What to Do Next
This might feel like a lot. Don’t worry. Just start here.
Define Your North Stars. Schedule a meeting this week. Agree on your 3-5 most important growth marketing metrics.
Calculate Your LTV:CAC. This single project will give you more clarity than anything else you do this year.
Build Your Dashboards. Start simple. A Google Sheet is fine. Create the three views we talked about.
Shift Your Team’s Focus. Start talking about quality, not just quantity.
Mastering your numbers is about trading confusion for clarity.
It’s about building a predictable system for growth.
It’s about having the right answer when your CEO asks, “Is our marketing working?”
Now, I’d like to hear from you.
What is the one metric you find most challenging to track or improve?
Let me know in the comments below.
Jump to...
ReLated Posts


Join The Growth Engineer's Digest
Get our best, data-backed strategies and frameworks delivered directly to your inbox. No fluff, just proven insights for building your revenue engine.
Stop leaving your growth to chance. The first step to exceeding your potential is a single conversation. Let’s build your roadmap to sustainable success.