Performance Marketing KPIs That Actually Drive Business Growth


I get it.
You’re drowning in data.
Your dashboards are overflowing.
Your team is celebrating “good traffic days.”
It feels like you’re winning.
But then you get that nagging feeling.
Or maybe it’s a direct question from your CEO:
“How is all this activity actually making us money?”
If that question makes your stomach flip, let’s talk.
My name is Ian, and for 13+ years, I’ve helped businesses answer that exact question.
I’ve seen so many leaders get lost in “vanity metrics.”
They look impressive but do nothing for the bottom line.
The difference between a marketing team that costs money and one that drives the business is a focus on the right performance marketing KPIs.
This guide is my playbook.
It’s the framework I use to help you cut through the noise.
Let’s build a clear system to track what matters, so you can finally be confident in your marketing’s financial impact.
TL;DR
Focus on KPIs, not metrics. A KPI is a metric tied directly to a business goal (like revenue), while a metric is just any data point (like clicks).
Know your “North Star” KPIs. For most businesses, these are Customer Acquisition Cost (CAC), Customer Lifetime Value (LTV), and Return on Ad Spend (ROAS).
The LTV:CAC ratio is key. A healthy business should aim for a ratio of 3:1 or higher, meaning a customer is worth at least three times what it costs to acquire them.
Use tiered dashboards. Give executives, managers, and specialists different reports with only the data they need to avoid information overload.
First Things First: Metric vs. KPI
Before we dive in, we need to get this straight.
It’s a simple distinction, but it’s critical.
What is a Metric?
A metric is just a number.
Clicks, impressions, followers, and video views are all metrics.
They tell you something happened.
What is a KPI?
A Key Performance Indicator (KPI) tells you if you’re getting closer to a business goal.
It’s a metric with a mission.
Getting a million impressions is a metric.
Acquiring 1,000 new customers from those impressions is a KPI.
Your team must understand this difference.
The Executive View: 5 North Star KPIs Your CEO Cares About
These are the numbers for the boardroom.
They are the ultimate source of truth for your marketing performance.
1. Customer Acquisition Cost (CAC)
This is what it costs you to get one new paying customer.
It’s the ultimate test of your marketing efficiency.
Read our complete guide on calculating Customer Acquisition Cost
2. Return on Ad Spend (ROAS)
For every dollar you put into ads, how many dollars come back out?
This is the lifeblood KPI for e-commerce.
I once helped a client hit a 592% revenue increase by obsessing over this number.
Read our complete guide about ROAS here.
3. Customer Lifetime Value (LTV)
This is the total money you expect from a customer over their entire relationship with you.
You can’t know how much to spend until you know what a customer is worth.
Read our complete guide about Customer Lifetime Value here.
4. The LTV to CAC Ratio
This is the golden ratio of growth. ✨
It compares what a customer is worth to what it cost to get them.
A healthy ratio is 3:1 or higher.
This means for every dollar you put in, three come back.
That’s a real growth engine.


5. Media Efficiency Ratio (MER)
This is your total revenue divided by your total marketing spend.
It’s a “blended ROAS.”
In a world with messy attribution, MER gives you an honest, high-level view of what’s working.
Check out the latest industry benchmarks for marketing KPIs here.
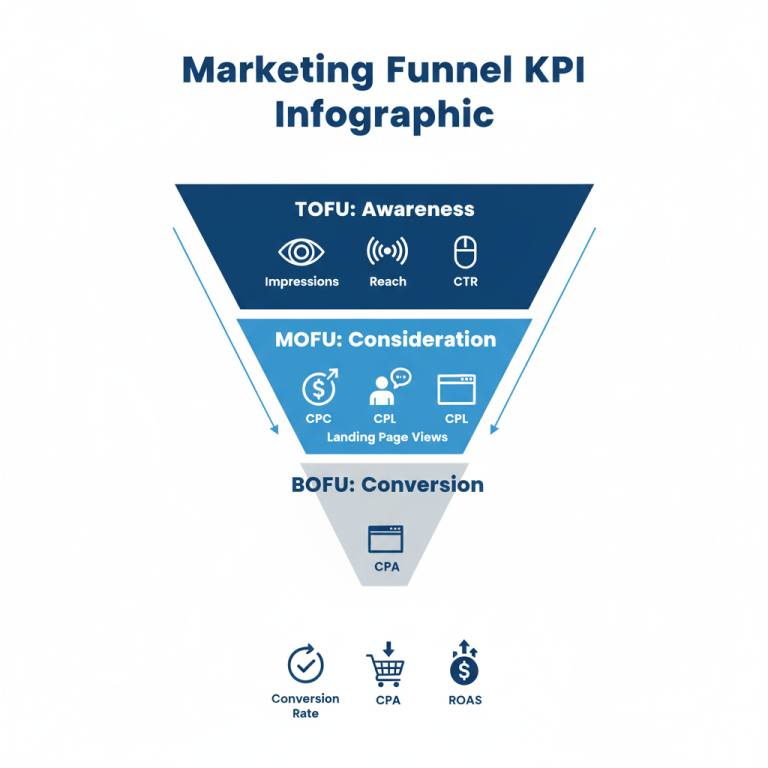
The Manager’s Playbook: 3 Tiers of Funnel KPIs
These are the diagnostic KPIs.
They are the levers your team pulls every day to improve the North Star numbers.
Top of Funnel (TOFU) KPIs: Getting Seen
Your goal here is awareness.
Click-Through Rate (CTR): Are your ads compelling enough to click?
Cost per Mille (CPM): What does it cost for 1,000 people to see your ad?
Middle of Funnel (MOFU) KPIs: Sparking Interest
Here you separate the curious from the serious.
Cost per Click (CPC): What are you paying for each visit?
Cost per Lead (CPL): How much does it cost to get an email address or a download?
Bottom of Funnel (BOFU) KPIs: Driving Action
This is where the money is made.
Conversion Rate (CVR): What percentage of visitors take the action you want them to?
Cost per Acquisition (CPA): This is your CAC, but for a specific campaign or channel.


The Channel Manager’s KPI Cheat Sheet
Every channel is different. Here’s a quick-glance guide to the performance marketing KPIs that matter most on the major platforms.
Paid Search (Google Ads) Essentials
Paid search is unique because it captures active intent. People are literally telling you what they want.
Key KPIs:
Quality Score: Google’s rating of the quality and relevance of your keywords, ads, and landing pages.
Search Impression Share: The percentage of impressions your ads received compared to the total number they were eligible to get.
Cost per Converted Click: The cost of a click that resulted in a conversion.
Click-Through Rate (CTR): The percentage of people who see your ad and click on it.
Cost Per Click (CPC): The average amount you pay for each click.
Conversion Rate (CVR): The percentage of clicks that result in a desired action.
Why It’s Unique: Quality Score is the most important lever a search manager can pull. It’s Google’s way of telling you how relevant your entire funnel is, from keyword to ad to landing page.
A high Quality Score is like a cheat code; it directly lowers your CPC and improves your ad position, allowing you to get more traffic for less money.
You can read Google’s official guide to Quality Score for more detail.
Paid Social (Meta/LinkedIn) Focus Metrics
Paid social is interruption-based. You are fighting for attention in a busy feed.
Key KPIs:
Frequency: The average number of times each person saw your ad.
Cost per Landing Page View: A more reliable metric than CPC, as it confirms the user actually loaded the page.
Lead Form Submission Rate: For on-platform lead ads, this measures how effectively your form converts viewers.
Engagement Rate: Likes, comments, and shares can be a leading indicator of ad relevance and creative effectiveness.
Return on Ad Spend (ROAS): The direct revenue generated from your social ad spend.
Why It’s Unique: On social media, Frequency is your guardrail against ad fatigue. If this number creeps too high, your performance will inevitably decline.
Also, while often dismissed as a vanity metric, a high Engagement Rate can signal to the platform’s algorithm that your ad is high-quality, which can lead to lower CPMs and better delivery.
Video (YouTube) Performance Indicators
Video marketing is about storytelling and holding attention over time.
Key KPIs:
View-Through Rate (VTR): The percentage of people who watched your ad to completion (or for a significant duration, e.g., 30 seconds).
Cost Per View (CPV): The amount you pay when a viewer watches your video ad.
Video Completion Rate: The percentage of viewers who watch your entire video.
Earned Actions: The number of viewers who took an action like subscribing to your channel, liking the video, or sharing it after seeing your ad.
Why It’s Unique: Unlike a static image, a video ad has a time-based narrative.
VTR and Video Completion Rate are the best measures of how compelling your story is.
Analyzing the audience retention graph in YouTube Analytics is incredibly powerful; it shows you the exact moment viewers drop off, telling you precisely where your creative is failing to hold attention.
The Strategist’s Edge: 3 KPIs That Connect Marketing to Money
This is what separates great marketers from good ones.
This is how you start talking about cash flow, not just clicks.
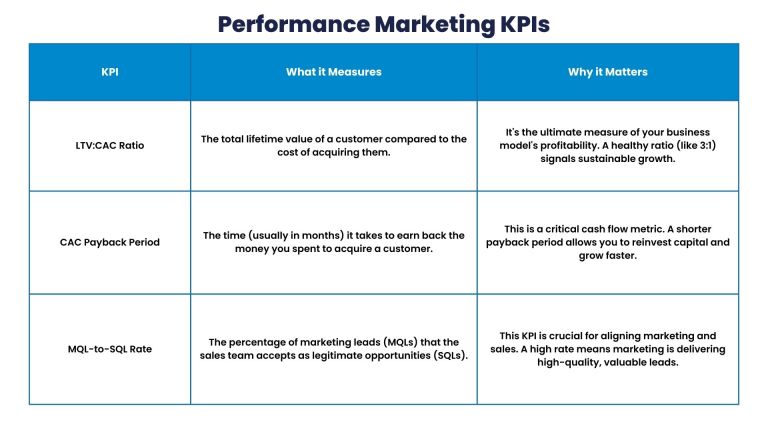
Using LTV to Set Your Target CPA
Stop guessing your budget.
Let your LTV guide you.
If your LTV is $3,000, a healthy 3:1 ratio means you can afford to spend up to $1,000 to get that customer.
This simple math is the foundation of scalable growth.
Your CAC Payback Period
How many months does it take to earn back the money you spent to acquire a customer?
This is a critical cash flow metric.
Your job is to make this payback period as short as possible.
Measuring Lead Quality (MQL-to-SQL Rate)
Anyone can generate cheap leads.
The real challenge is generating leads that sales can actually close.
The MQL-to-SQL (Marketing Qualified to Sales Qualified) rate is the handshake metric between your marketing and sales teams.
A high rate means everyone is aligned and focused on revenue.


Your Final Action Plan
Knowing your KPIs is the easy part.
Here’s how to put them to work in the real world.
Cure Your Dashboard Overload
Use tiered dashboards.
The Executive Dashboard: Just the 5 North Star KPIs.
The Marketing Lead Dashboard: Funnel metrics and performance overview.
The Channel Manager Dashboard: The nitty-gritty, daily numbers.
Schedule a Free Growth Roadmap Session
It’s a strategic chat, not a sales pitch, designed to give you clarity.
Build a Culture of Profitability
You get the behavior you reward.
Tie bonuses and praise to the KPIs that matter to the business.
Celebrate lowering the Cost per SQL, not just generating more leads.
This is how you get your team to own business results.
It’s how you turn marketing into a predictable growth engine.
What is the one KPI you’re focused on improving right now?
Share it in the comments below!
Jump to...
Join The Growth Engineer's Digest
Get our best, data-backed strategies and frameworks delivered directly to your inbox. No fluff, just proven insights for building your revenue engine.
Stop leaving your growth to chance. The first step to exceeding your potential is a single conversation. Let’s build your roadmap to sustainable success.


